Hi guys, I came across this Investor RT thread on Twiter https://twitter.com/investorrt/status/1047475694480052224
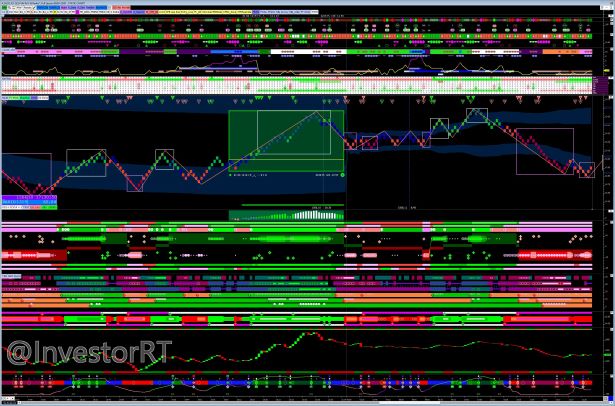
and shows and complex chart shared in 2018. Is the person who created this chart still on this forum? Are there any details about the tools he is using ? Maybe there is a thread already on this forum and somebody can point me in the right direction. I am curious about the tools used on this chhart.
Thanks
Hello Stefan,
let us know a bit more clearly what you would like to know about the RTL tools & indicators I did use in this chart, ie which element in which section/pane of the chart .
I am not sure how familiar you are with Investor RT as some of the combination of indicators used in this chart do require some experience with the software.
If you are not familiar with some of the key tools (Color markers, Paint indicators, Zone, Bar Statistics etc), you will find here a very exhaustive depositery of chart definition illustrating all the main individual features of IRT, as shared by Chad in the past years :
https://www.linnsoft.com/chart-share/cpayne
When you mix most of them a single chart, that's the kind of result one may achieve..
Eddy
PS : Obviously, I am here to open a discussion about the IRT toolkit box, indicator wise, not to discuss any specific trading strategies or systems..
For the record, this chart was obviously not used for any discretionary trading, but is more a support to display many different parameters that may be used to build individual signal rules (each of them being part of a more complex trading system..)
Hi Eddy, Thank you very much! I am more interested in the IRT toolkit and what you can do with them. I am new with IRT so I am trying to learn the tools. I appreciate you put a lot of work in that. Am I asking too much if you are willing to share that chart deffinition? I am more than happy to pay for your work.That will give me a good start to try to disect each component and try to understand it. Otherwise thank you for the link and I will try to dig in those example.