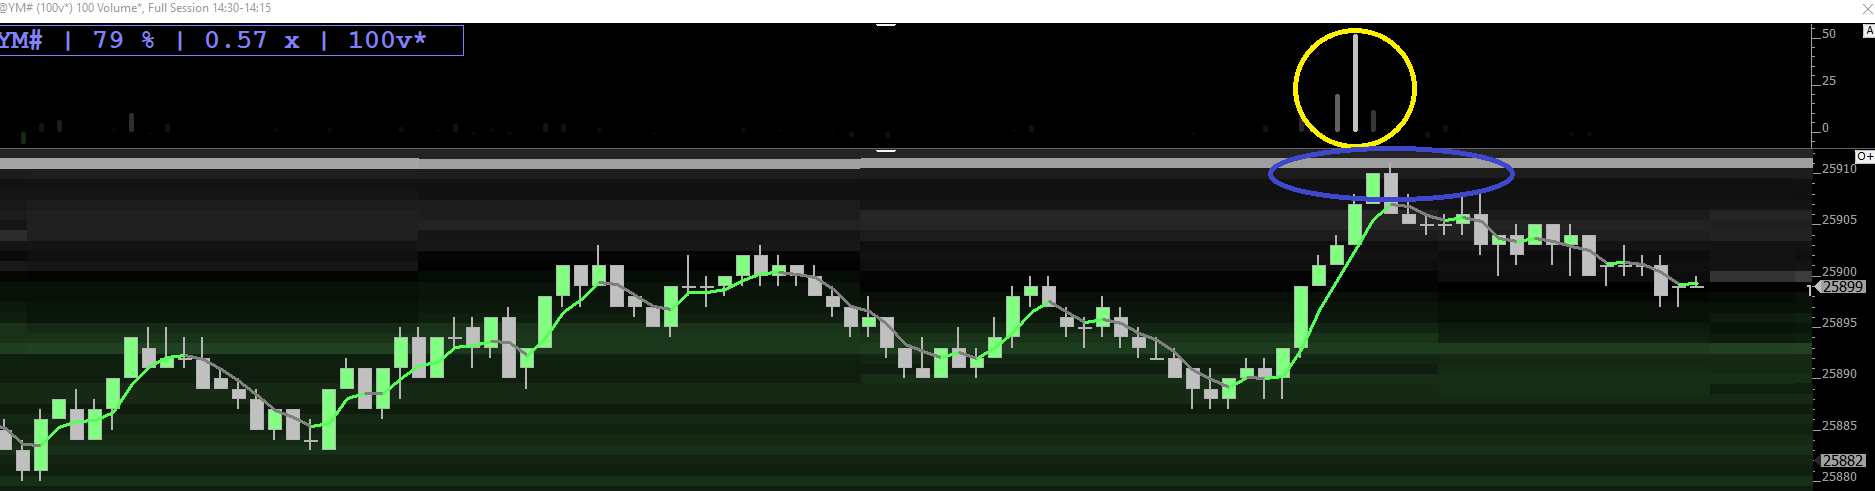
As a follow-up to the post about TINT trails and other indicators firing at the same time, below is an example that I just saw in the YM up at 25910.
Indicator in top pane is VB speed per second and you can see the print in Trails is at, or very near, the same price where the VB indicator spiked. (This VB speed per sec, in my opinion, is one of the indicators in IRT you can use "off the shelf")
Really cool and I think useful and gives me conviction and confidence in making a decision.
For instance, if I were long going into this I would A) take a profit or B) tighten up a stop to break-even or better. Or, if I wanted to try a short, after a big rally since the open today, that was as good of a spot as any.
And here's where I think the TINT trails can be useful, almost as a filter itself, especially contrasted against some of those spikes in VB speed per second:
The VB speed per second can spike quite a bit when the market is moving, relative volume is high, and a decent number of market participants are engaged, active, and trading. But some of these spikes, especially during decent trends, aren't very effective/are not very good predictions. I have theories on why this is.
Other times, this indicator will often pinpoint the day's high and low, and can be remarkably precise and a highly effective leading and predictive indicator.
And what I'm finding is the TINT trails can, sort of, filter the spikes in this VB indicator, as an example. I'm seeing similar instances across most of my other indicators too, when these big orders hit the order book, vis-a-vis TINT trails.
Admittedly, this type of analysis and decision making is subejctive. But, man...if you have a solid foundation of a trading system that already defines trend, predicts price, and a solid timing element...well, at least I'm finding, that the Trails adds some real interesting nuance and its application is almost like another filter and it's like:
"Yes, take this trade with conviction! Maybe even increase your size."
Other times it's like:
"Hold on, wait a minute. Just got a buy signal, but a couple of big sell orders just hit the book. Maybe pass on this one, or wait for more information."
Good stuff. Could you share the chart definition with the settings you have in the picture?
I'm also curious as to what you think is an ideal periodicity for using trail of intentions? Which timeframe is too big of a timeframe for any of this to be relevant?
Hey man, I don't know how to do the chart definition thing and I can't figure out how to post more images in a forum post.
So, let me make another post and I'll put some images on the Indicator Preferences for both. Might help.
Just right-click in chart and "Share Chart > Linnsoft"
LOL...I can probably figure out how to do that.
Thanks, man.
Hey Chad,
Could you tell me how I can get the candlesticks to be shown in front of the trail of intentions? Currently I have the tint flowing as orders come in although my candlesticks are behind and cannot be seen.
Thank you
Right-click on TINT and choose "Send to Back".
This looks really cool, Would you mind positing your definition?
Hey there, I was just using that chart as an example. Don't have a definition to share.
But it's easy to recreate.
The top pane is the Volume Breakdown indicator, specifically it's Ask vs. Bid Traded, Volume, Delta (Buy - Sell Vol) and as the statistic, it's Speed (Per Second).
Bottom pane is Trail of Intentions set to a 1-second snapshot