Hey guys,
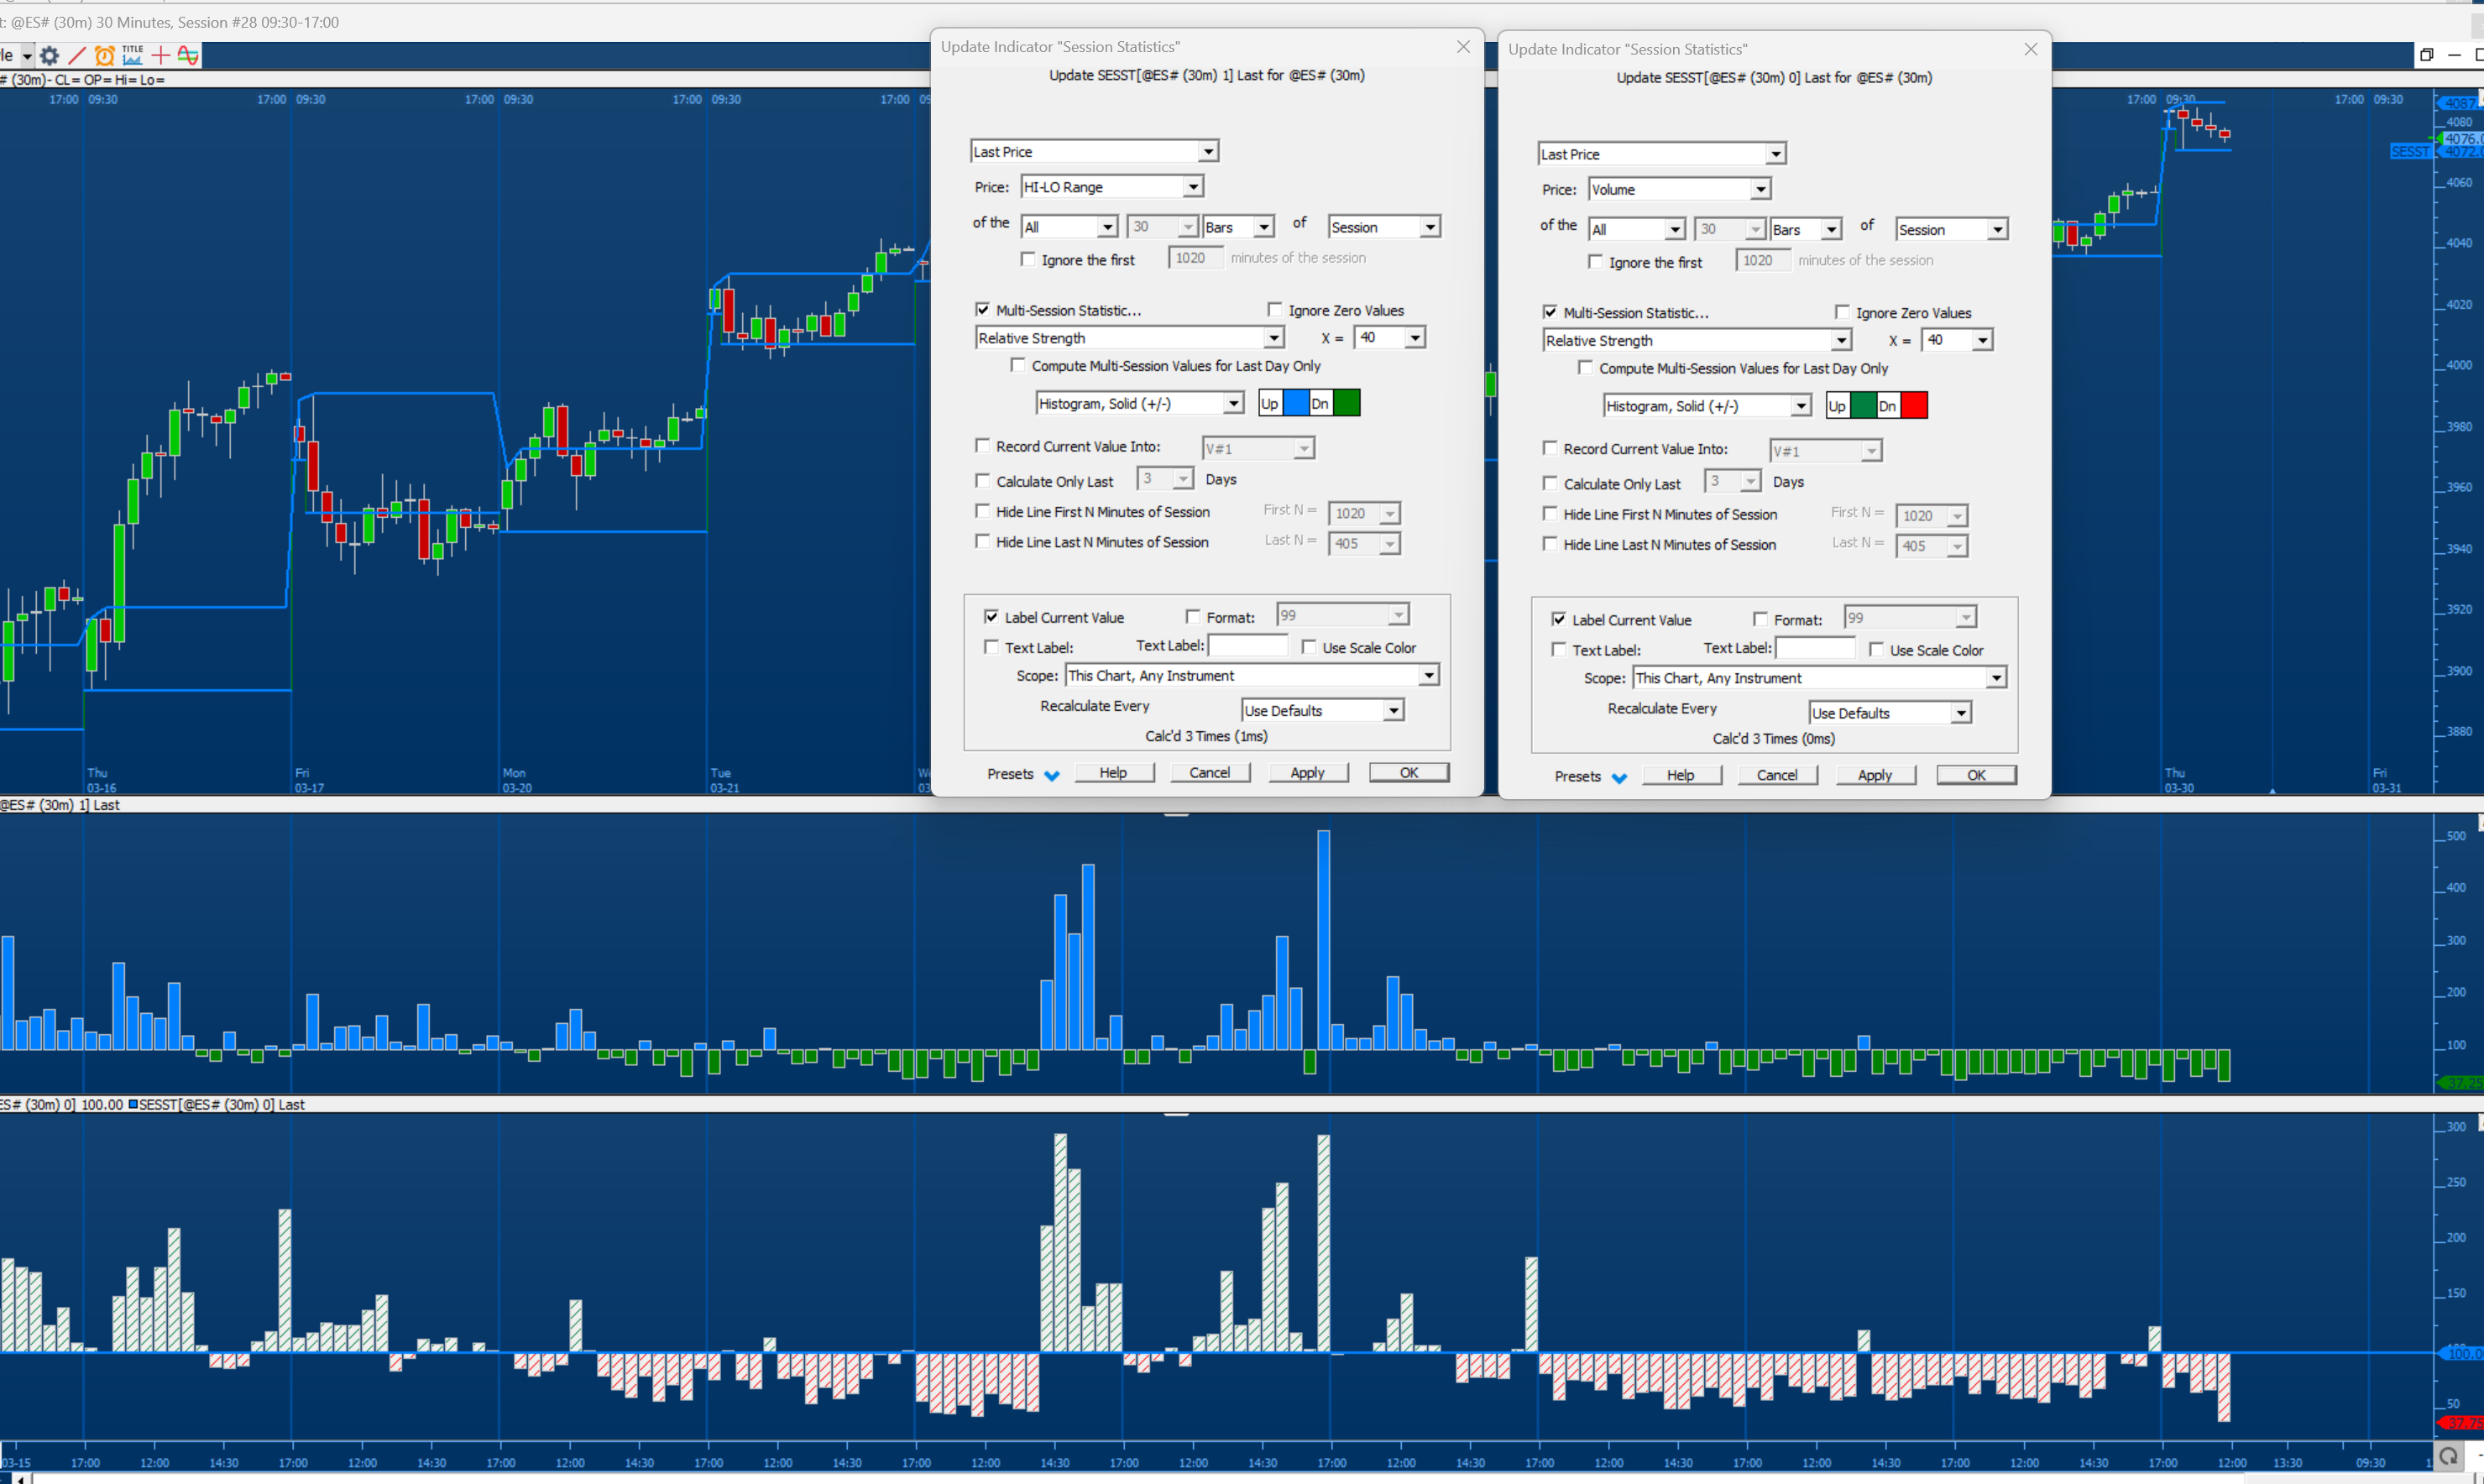
I watched this video... https://www.linnsoft.com/videos/session-statistics and dont seem to be getting the same results he does after he switches things to Relative Volume, In video all values appear to be plotting as positive numbers but when i tried creating same setup i have negative numbers as seen in pic i attached. In my system it looks like 100 is my centerline instead of zero. Am i looking at this the wrong way and numbers can be negative. I thought each bar was supposed to be a representation of how strong it was compared to all the bars at the same time of day over previous 40 days which i believe should only allow positive numbers.
Thanks in advance!
Can your share your chart definition and we'll check it out.
Ive attached a txt file of the Chart definition
Thanks.
Difficult for me to see in your image, but are you sure those are negative values? I think the histogram is just plotted with a base of 100 (instead of 0). Could that be the case?
Yes you are correct. I started typing post first and then took the snapshot to add. When i attached it I realized 100 was centerline but again referred to it as negative . Sorry about that. Is there a way to get my chart to use 0 as the base instead of 100? Or has something changed with IRT since that video was made and what im seeing is now standard?
Thanks again.