
The Multiple Price Highlighter (MPH) indicator is extremely versatile and can detect a number of volume-at-price patterns across one or more prices within each bar.
In the chart below, MPH is added four times and detects the following 4 cluster conditions...
- Turquoise Solid Blocks - High Volume Cluster - Identifies the 3 price cluster (consecutive) that has more volume than any other 3 price cluster in the bar.
- Gold Solid Blocks - Low Volume Cluster - Identifies the 3 price cluster (consecutive) that has less volume than any other 3 price cluster in the bar.
- Blue Hollow Blocks - Buy Imbalance Volume Cluster - Identifies the 3 price cluster (consecutive) that has largest buy imbalance than any other 3 price cluster in the bar.
- Red Hollow Blocks - Sell Imbalance Cluster - Identifies the 3 price cluster (consecutive) that has largest sell imbalance than any other 3 price cluster in the bar.

With these highlighters in place, you can quickly see at a glance where the heaviest and lightest volume occurred during formation of the bar, as well as the heaviest areas of buying (imbalance) and selling (imbalance).
The MPH setup below implements the High Volume Cluster...
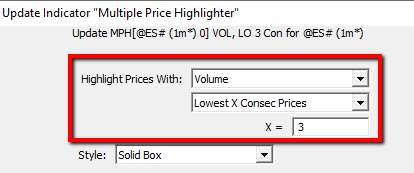
Here is the chart definition: https://www.linnsoft.com/charts/mph-significantclusters-es
If you have any questions about these setups, or have additional volume-at-price patterns you'd like to detect with MPH that you're struggling to setup, please respond to this ticket with details.