Chad,
I'm loving this Paint Indicator. Making some pretty charts. :-) In all seriousness, the gradient helps add another dimension to my analysis. Super cool and useful! Thank you!
Is there a way to use the Paint Indicator to change the color of some V# variables I'm displaying in an Annotation?
Here's what I'm after:
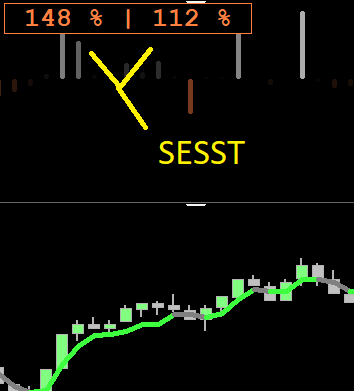
I love your SESST indicator and, in particular, relative volume is SUPER useful information. These data are HOW I adapt to changing market conditions.
Like you can see in the attached image, I'm displaying two relative volume figures as percentages.
I'm pulling these figures from separate time-based charts and displaying in a volume-based chart.
I'm using V# variables to call the relative volume figures into my volume-based chart, , using an ANNOTATION.
I want these figures to CHANGE COLORS based on the relative volume.
For example, let's say relative volume spikes to > 200%, I want to color it hot pink because, well, the market is HOT!
But let's say relative volume drops to < 50%, I want to color the figure light blue because...you know...the market is cold, slow, and in balance.
I've been tinkering with the Paint Indicator and CIs, but can't get this to work.
Any suggestions?
Thanks in advance,
Eric
Stand by. I've begun work on an RTX Meter indicator that will meet your needs and more. Will provide updates as I move along.
I just want to say thanks, man. I've been with you off and on for over 10 years. You are stepping up your offering with some seriously powerful tools. Stoked to see where you keep taking RTX.
Hey galstein,
nice post about color. I also liked the dark background from think or swim and have been using it with Linnsoft. Much easier on the eyes.
I also noticed this post and would like to ask if you could share how you track relative volume and if you could maybe post a chart definition of that.
Thanks,
Steve
Hey Steve,
My chart definition won't do you any good. But let me explain how I use relative volume and you can adapt to your style or system. Here's some context:
That word/idea "adapt" is everything to me as a trader
I'm super active futures day trader in Asia and U.S. equity indexes, FX, and commodities
I trade based on volume-based charts
Problem with volume-based charts is that relative volume is a calculation that needs to take place in the time domain, like a 1-minute, hourly, or daily chart. I already have quite a lot going on in the volume-based chart I'm trading from in terms of inputs, outputs, indicators, tools, etc. I don't want to bog it down and it's essential to my system that my charts are moving fast.
I never look at the charts on which I'm calculating relative volume. Instead, they are running in the background and based in the time domain. I've experimented with doing this calculation other ways like a Quote Page. But the key point is that I'm declaring variables in the time domain charts and then pulling those variables into my volume-based charts. I've just settled on this way after lots of testing because it aligns with what my computer and internet connection can handle and what I can actually keep up with as a point and click trader.
I calculate relative volume at the 50-second and 5-minute intervals. But let's say I were an overnight swing trader of FX futures, and held positions for hours, or even a couple days. I might start with a 30- or 60-minute interval. Maybe 12 hours. I encourage to experiment with intervals and really give thought to and try to find what makes the most sense for your trading style. Shoot, I've built indicators using relative volume calculated at the 1-second interval.
At these 50-second and 5-minute intervals, I only go back 5 days. Some will argue that's way too short, but I landed on these intervals after lots of testing and observation. The 5-day look-back works for me. Importantly, it gives me some efficiency in the calculations. You might start with 20-days.
I set my variables to update with each bar for some more efficiency gains and I'm doing all these in a 5-second chart. So, my numbers on the screen of my volume-based chart update every 5 seconds. Honestly, that's probably faster than I actually need, and could probably do just fine with 15 second updates.
Lastly, I use a cash session for equity indexes, but 24 hours for FX, crude oil, gold, and the other markets where it makes sense.
I would encourage you to give a lot of thought about all these details. They all matter in this calculation.
The finished product is just some numbers I display on my volume-based charts, using the variables and the Annotation indicator. (Check the chart I emailed you/couldn't figure out how to post in this reply.)
That last number on the end (0.77 X) is a historical data token in IRT that you can call with %XAVGVOL -- it's pretty useful for relative volume and tells you today's (or think percent, just move decimal place as in 77%) volume compared to the 20-day avg.
And with these 3 numbers I have a really good understanding of how active I SHOULD BE. One area of trading where I had the biggest problem in the past, and probably lost the most money, was forcing my will on the market. This almost always happened when it got slow and I started over-trading. So, I firmly believe, there are 3 distinct states in which my trading capital can be: long, short, and out of the market. And this last, particularly in U.S. equities, is super important for me.
But, Steve, I try to keep it simple with the application. If 50-second and 5-minute relative volume is 75/80% or higher, then I'm engaged and taking risk. I use the 2 in tandem to sort of filter the fleeting spikes that arise at the 50 second interval. If relative volume is 50ish% or lower, then I try to be humble by recognizing that traders who have better information, can move faster, and have much deeper pockets than me, are not risking their money. If they aren't, then neither should I. And this is how I prevent over-trading and how I removed the fear of missing out from my trading -- FOMO was a huge problem, too.
The adaptability part -- I frequently change the unit of volume I'm charting based on relative volume. This is super important for me. For example, let's say I start the day trading the RTY. And it's active and moving and my relative volume calculations are flashing 238% and 145%, and I'm using an 80 volume bar. Couple of hours into the day, volume dries up at 65% and 85%, moves get smaller, and I drop down to a 20 volume bar.
I'm adapting the window through which I'm trying to predict the market to the volume/speed/rhythm of the market. I believe this to be essential to making money in short-term trading.
Eric,
Thanks for the insight about how you use relative volume. I'm actually glad you shared, although you might have misunderstood my question.
I'm using relative volume on a quotepage and was curious how you got it running on your chart shown as a percentage. I'd also like to have it on my chart so I don't have to open additional windows.
Thanks once again,
Steve
Gotcha, Steve.
I would create a custom column out of your relative volume data in the Quote Page.
Then, declare that data a variable in the custom column. For example, V#13.
Now, call that variable into Annotation indicator on your chart, and do so using this:
%V#13
The "%" preceding the variable is how you call the variable.
You enter the above in the "Text" field of the Annotation indicator.
The output is NOT a percentage, so all I do is add a "%" in the Annotation. Like this:
%V#13 %
Lastly, you can call %XAVGVOL for the 20-day AVG vol to display in your Annotation. This is a historical data token in IRT and I find it useful to gauge relative volume at a higher level/bigger picture/longer time. This output is a decimal, but you can read it as a percentage, or make a simple custom indicator to turn it into a percentage if you want with:
100 * XAVGVOL
Amazing.
Thank you so much!
Just wanted to give you an update and let you know I haven't forgotten about this. I've actually been spending quite a bit of time on it and am pretty excited about the results.
Below gives you an idea of on of the possiblities of this Meter indicator I'm working on, specific to your situation. In this case, it's plotting the relative volume with manual min/max scaling at 50 and 150. You have complete control over what drives the meter (custom indicator or instrument), and the scaling (automatic or manual extremes), as well as shapes (semicircles, quadrants, blocks, all with 4 orientations). Lots of options....background of meter can be gradient (2, 3, 4 color), or solid wedges of 2, 3, 4 colors, options for the hand, and more. You could load your chart up with 20 of these if you wish. I hope to make this publicly available in the next week. Suggestions welcomed.
Any update in this?
It's ready, and we hope to be able to release early next week.
Pages