One of the outputs on my charts is John Ehlers Empirical Mode Decomposition, using the trend component. I use this to help make buying and selling decisions.
A week ago or so, Chad shared that he's working on a meter indicator, that I'm going to use to gauge relative volume. Two things dawned on me: 1. It's really cool to me that my charts are going to start looking more and more like a pilot's heads up display. LOL
2. The meter inspired me and I thought I might be able to also use it to define market mode.
I have 5 outputs that I use to make buy/sell decisions. It's a lot. The meter might help me reduce it to 4. Could be a big deal for me and simplify things even more.
So, what's this market mode indicator all about?
Ehlers thinks about the market as having 2 modes: cycle and trend
A technical analyst might think of "cycle" as "range bound" or in "consolidation," a market profiler might label these phases "balance" -- it's all describing those periods when the market oscillates, swings from a high to a low, sometimes drifting up or down, and other times, moving almost perfectly sideways on your charts, in between a clearly defined range of highs and lows.
I think all traders, using all types of analysis, can agree on what a trend is.
And if only you knew, or at least had a few clues, about which type of mode the market is in RIGHT NOW, you would know how to trade and what to do.
For example, if you can tell me quickly and accurately that the market is entering a cycle mode right now, then I would know to apply a a buy/sell logic that would have me trying to buy low and sell high, and to keep doing that. But, what if, on the third time I buy low, instead of selling high, I should probably hold. This would be when the market is transitioning from cycling to trending. I should hold my winner and let it run.
The flip side is when should I NOT short? Because in cycle mode, it makes sense to take the shorts, too, and trade both sides, particularly because I'm trading futures. You could make the case for no, or limited shorting, if I were trading stocks.
But, in my opinion, if you can regularly and accurately define these modes, then buying and selling decisions get pretty easy. For instance, the Band Pass filter ( you can find this under the EMD indicator b/c B.Pass is used in Trend Component calculation ) that I've talked about in another post -- well, if you can reliably tell me that the market is cycling right now, then I could probably get away with applying only the Band Pass to make buy and sell decisions. And I could probably make a lot with that one indicator alone, applied across a couple of different futures markets.
But what about the trend mode? Shoot, if you can reliably tell me when the market is going into and coming out of trend mode -- well, I could probably get away with making buying and selling decisions using only a moving average of a couple bars applied to a filtered price.
Now, keep in mind, both claims above are based on indicators that, in my view, are not at all PREDICTIVE of price. Both indicators, applied in the ways I've described, are coincidental, and lots of times they are lagging by a bar or two. I mean -- the moving average in the trend application is TRACKING price. But I stand by these claims IF AND ONLY IF you can reliably and accurately tell me which mode the market is in. That's how significant I think measuring and defining the market's mode is in the overall process.
This brings me back to Ehlers EMD Indicator, using the Trend Component, and what it does is tries to define cycle and trend modes. But I have 3 problems with it and it's because of the way I trade. Want to say that I'm super grateful to Ehlers for sharing this technique/concept, though. It's just that it doesn't work for my style, off the shelf, in 3 ways:
1. 4/5 of the outputs on my chart are what I describe as "universal" and "fractal."
Universal in the sense I can apply these exact same indicators and, importantly, the same parameters to any and every electronically traded,market around the world. Soybeans, stocks in Japan, HSI futures, gold, VXX, AAPL, TSLA puts, bitcoin, spot forex, bonds, electricity. It's all the same to me.
Fractal in the sense that the same parameters work across all frequencies/periodicities/intervals/time-frames. My interval, the unit of trade that I use, is volume. So, I can apply 4/5 of my outputs to a 5000 V of the ES, or 10 V of RTY, or 66 V of CL, without touching look-back periods or indicator parameters.
Now, there are definitely benefits to be had by slightly tweaking some of my parameters from one market to the next because, obviously, the principles governing the RTY, for instance, are going to differ than gold or crude oil futures. But, for the most part, I could get away with using the same parameters on 4/5 of my outputs, across all these different intervals. It's all the same.
The 1 indicator that is not universal and fractal is the EMD, Trend Component. And this just rubs me the wrong me way. ( BandPass is fractal and universal, BTW)
2. It's too slow in changing modes.
3. It doesn't "stick" at the extremes and there's just too much relative judgment in the "degree" of trend mode, up or down, that I read from the output. It's not clear enough for me.
But the concept, the technique that Ehlers is using, I think could be modified a little bit, to make the market mode indicator work better. My 2 goals are to make it work faster in switching modes and 2) more clearly define up trend and down trend mode, and when the trends end.
Let me come back to that concept of "stick at the extremes" in your indicator output. I've seen this across lots of indicators on IRT and there are lots of ways you can achieve this visual output like the chart below. I won't bore you with the math or why/how, but you should see what I see. That's what I want from my output and whether you automate something like this or just look it, etiher way, I think it's more clear.
But, to get that visual output, I'm going against what Ehlers advises in how and when to apply a Fisher transformation and on which data types. This makes me nervous.
Anyway, to achieve this output, I'm using a Fisher transformation in a some creative ways -- it's the FISH indicator, applied to price.
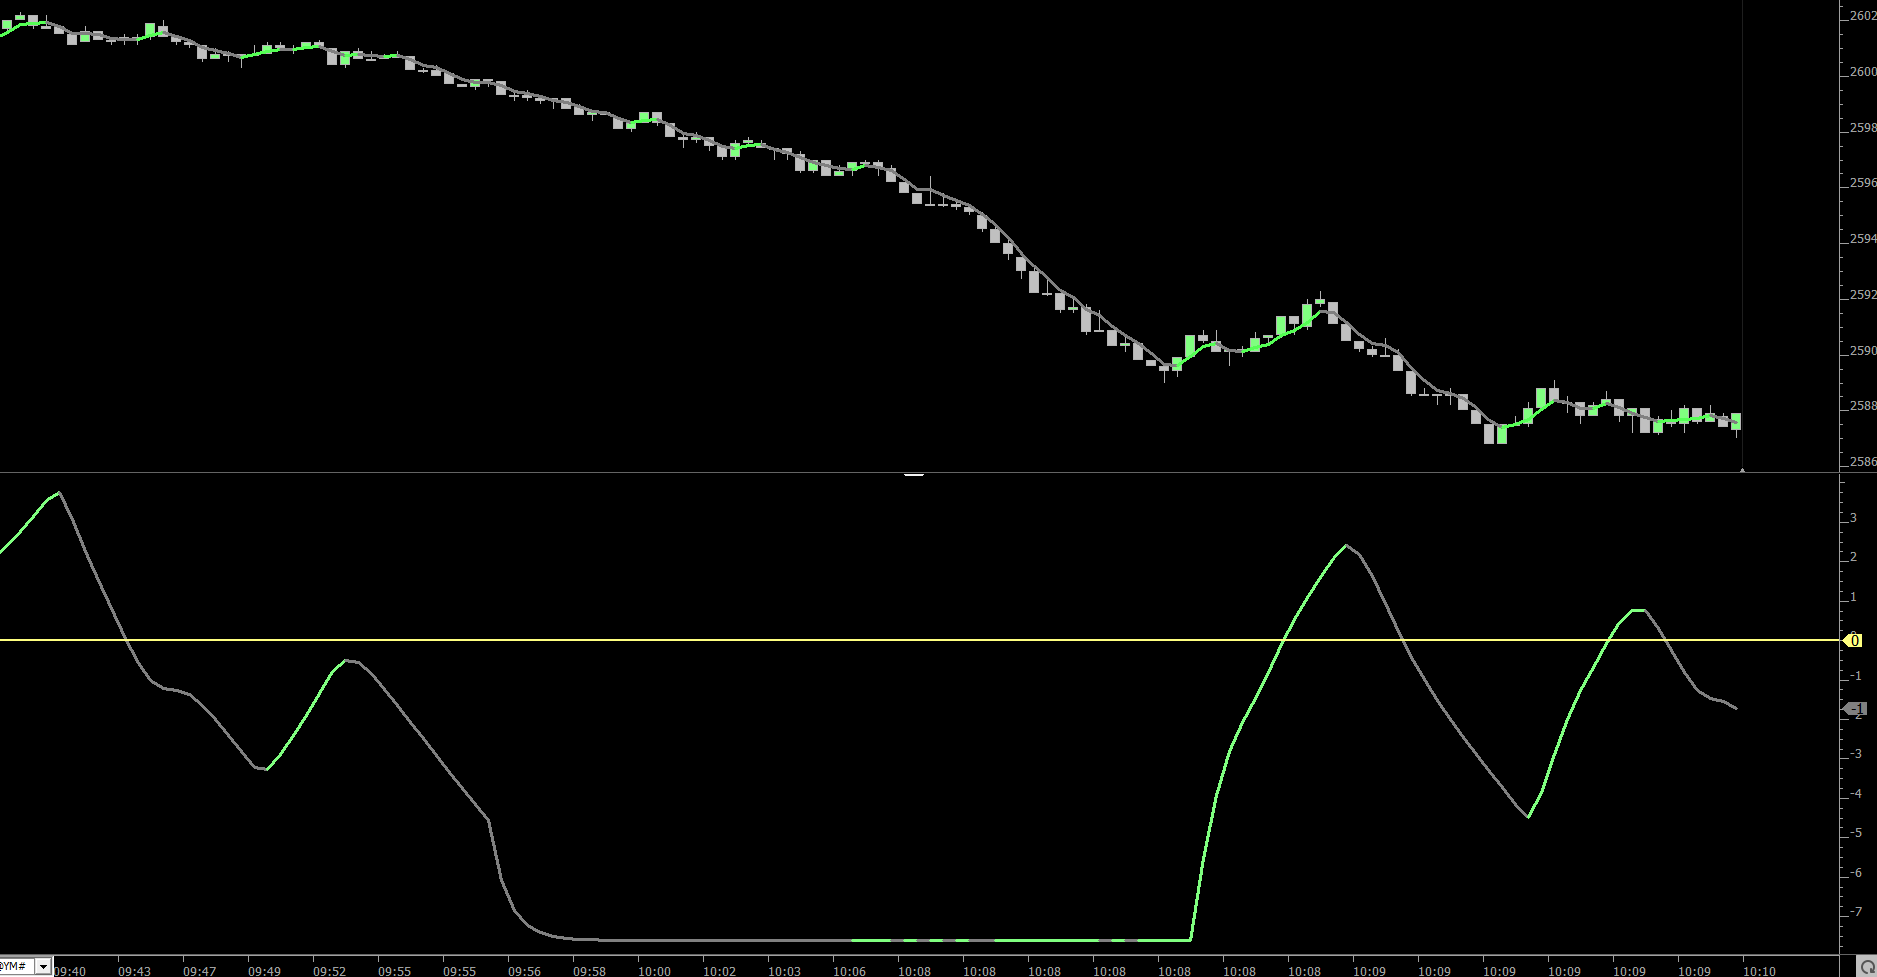
What's critically important to remember here is this is NOT a tool or output that has anything to do with predicting price or timing a trade. Not in the way I'm applying. But it is ONLY used for measuring and defining market mode. So, the fact that the turns in the output, coming out of the prolonged downtrend, lag price, as the YM transitions from down trend, back to cycling -- you can see 2, 3,, 4 bars of lag -- the lag doesn't matter in this case. And, in fact, in this application, it's almost exactly what I want out of this output.
I'm just pointing this out because it's easy to start confusing your indicators, how you're applying, and you can start to get some really confusing overlap. Easy for me anyway, with 5 outputs on the charts.
Anyway, I just wanted to get this post up because I was kind of excited to start to see this output. It's too early for me to conclude, but it's looking like it's faster and more clear.
One last thought on this mode problem is this:
I'm finding that inputs, OTHER THAN PRICE, could be useful in defining market mode. I'm seeing good indications from a few Volume Breakdown inputs. I haven't yet looked into order book data, but it might be better than price as an input.
And, you know, more broadly, I sometimes wonder if volume in its raw form, or even volatility, might be better inputs to determine market mode, than price. I don't know if Ehlers technique would apply with these as inputs, but maybe a version or modification of how Ehlers does this, could work with these other inputs. It could be especially effective if you can quantify that relationship between volume and volatility in the cycle and trend modes. There are recurring, very distinct signatures in both, as markets start cycling, and when the start trending, and when they stop trending, and start cycling again.
Anyway, here's that output on the YM. This is a 100 volume bar chart, and focusing on that big slide from Friday morning. See how the output "sticks" at the lower boundary?
Great points,
to continue this I would have to say that volume is one of the most important factors. Markets can and will move on low volume, although the probabilities will simply point to better price movement on higher than average volume.
Some will track relative volume over the past week, minute to minute, while some just check the first 30 minutes of a session where in U.S. stocks, that's the most active time.
Of course the trader must know his timeframe to help noticing a trend and rangebound market. Ranges can take places within trends and trends can take place within ranges.
That idea of ranges within ranges, trends within trends -- that's at the core of my problems with the EMD, Trend Component, and what I'm trying to improve. All these cycles and trends can co-exist because the markets are fractal, but a problem arises from this, that Ehlers terms "spectral dilation." A basic way to think about this is you can lose information/speed/smoothness/predictability when you change the periodicity of your chart. You can try to get this back on the fly by changing your indicator parameters, but that's prone to error, more complex, and n clunky solution.
I've gotten around this problem in most of my other outputs, except for this one that defines market mode.
Anyway, thanks for the input, Steve.