
Most users are familiar with the use of RTL Tokens when compositing Custom Indicators, Signals, or Scans, but Tokens can be used in other areas of Investor/RT as well. By simply placing a % in front of the token, then underlying data/information can be displayed dynamically in a variety (any) charted indicator, including.
- Horizontal Reference Line Labels
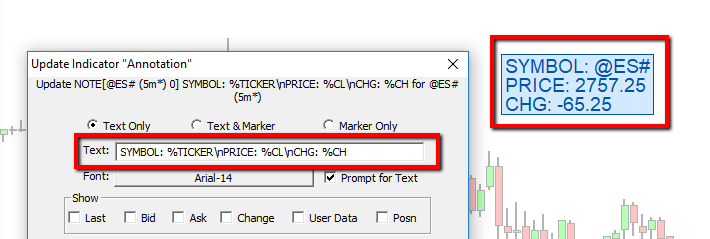
- Annotation Indicator Text
- Trendline, Zig Zag, and Regression Line Labels (Choose Label: User Specified...)
- Signal Markers (Show Text) and Signal Action (Message Text)
- Watermark Custom Text
- More generally, any RTX indicator that includes a Title or Text option (Footprint, PaintIndicator, FlexMeters, Clock, and many more)
- Text Label of ANY Indicator (the text label at bottom of all indicators at the bottom of the preference window is used to label values next to scale and can also be a tokenized string)
In addition to this Comprehensive List of RTL Tokens, there are a numbrer of additional tokens that are more targeted for use in text of charted indicators. These tokens access chart specific or instrument specific data. A list of such tokens along with a description of what they provide can be found at bottom of this post. To access token data in indicator labels and text, simply put a percent % in front of the token. Below is an example of Annotation Text and the resulting chart display. In annotation, \n results in a newline allowing for multi-line annotations from a single instance.
| Token | Descripton | Example |
| ALERT | ||
| DATE | Date and time of last recieved quote on the underlying symbol | 02/02/2018 10:15:28 |
| @1, @2 | For Custom Instruments, provides respective underlying component | @ES# |
| DTHM | Curent Date Time with Hours Minutes | 02/03 11:49 |
| DTHMS | Current Date Time with Hours Minutes Seconds | 02/03 11:49:32 |
| DAYNAME | Day of Week | Friday |
| FEED | Data Source | IQFEED |
| MSG | Shows last message that was posted to the message bar | Data Loaded 0.17 Seconds |
| DESTACCT | Brokerage Destination | Trading Simulator |
| ACCT | Trading Account | |
| ACCOUNT | Trading Account | |
| CR | Carriage Return | |
| TIME | Time of last trade received | 16:14:59 |
| DTIME | ||
| NOW | Current Time (hh:mm:ss) | 12:17:45 |
| CCNAME | Custom Column Name - Used When CC Alert Triggers Schedule | |
| CCRULE | Custom Column Rule - Used When CC Alert Triggers Schedule | |
| CCTICKER | Custom Column Ticker - Used When CC Alert Triggers Schedule | |
| DIR | Investor/RT Working Director | C:\Users\Tom\InvestorRT\ |
| DBDIR | Directory in which the Investor/RT database (data_f folder) resides | C:\Users\Tom\InvestorRT\ |
| VER | Current Version of Investor/RT | 13.2.2 |
| TR_STATE | Current Live Trading State/Position of underlying symbol | LONG 2 |
| TR_STOPTARG | Active stop/target orders if applicable | |
| START | Starting Date Time of Chart View Period | 01/29/2018 16:30 |
| STARTDATE | Starting Date of Chart View Period | 01/29/2018 |
| DRAWTIME | Time (in milliseconds) require to draw chart | 1ms |
| BARSVISIBLE | Number of Bars in visible display of chart | 58 |
| BARCOUNT | Number of Bars loaded in chart | 1092 |
| SESSION | Session number of chart | 31 |
| SESNAME | Name of session of chart | 24 Hour Session |
| SESSSTART | Start time of session of chart | 16:30 |
| SESSTOP | Stop time of session of chart | 16:15 |
| BARLEFT | Time left in bar for time-based periodicities. Price moved needed to complete bar for price-based periodicities (Renko, Range). Volume left for volume bars. Ticks left for tickbars. When session closed, shows time to start of next session. | 02:34 |
| BARPCT | Percentage of current bar completed. If current bar of 1000 volume bar has 100 contracts, then BARPCT shows 10% | 10% |
| T#1 | Text Variable (File > Preferences > User Variables) | NEARING DAY SESSION HIGH |
| V#1 | User Variables (File > Preferences > User Variables) | |
| C#1 | Chart Variables | |
| RETENTION | Tick and 1-minute data retention settings | 20d ticks, 500d intra |
| PERIOD | Periodicity of chart | 5m* |
| DELAY |