Exactly. When the Color Basis is set to Delta, and the dot is white (or matches whatever the background color of chart is), that is indicative of the bid volume being equal to the ask volume at that price.
"Accumulated filtered trades" Option in Trade Dots
Hi Chad,
could you give some information on the filter feature which was added to the trade dots RTX ?
While the filter option itself looks quite straight forward, I am not sure about the "Accumulate Filtere Trades" checkbox and what "Draw Trades as Text" would/should return
Thanks a lot
Eddy
The "Filter" works a little different depending on whether "Accumulate Filtered Trades" is checked or not. When not checked, it will filter the net volume at each price. If checked, it will filter ALL trades...and in that situation "Draw Trades as Text" is available which tells you how many trades happened at each price which met your filter criteria.
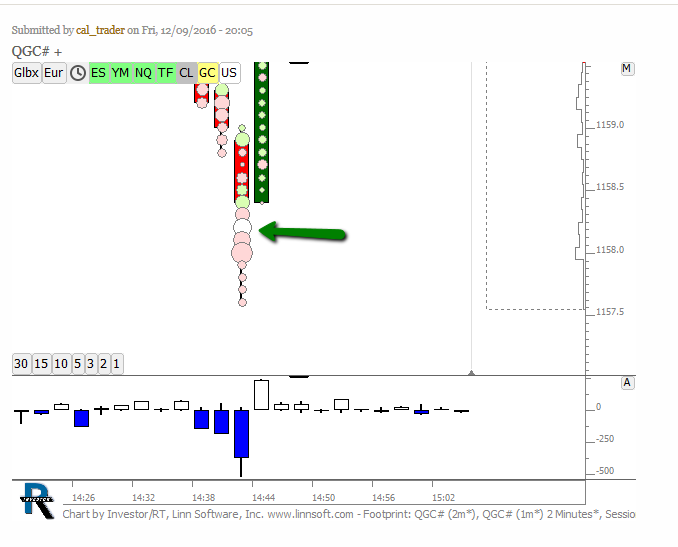
Essentially, when "Accumulate Filtered Trades" is checked, TradeDots then considers all trades within each price (within each bar), not just the cumulative volume at each price. In the chart below I've used VolumeCandles to show the volume at price as text and put 2 instances of TradesDots on either side of that text. On the left (in blue), "Accumulate FIltered Trades" is turned on, while on the left (yellow) it's turned off. Otherwise, settings are identical. I'm sing the button at top of the chart to control the volume size filter level, set to > 100 in this chart. So first look at the price pointed to with the blue arrow. At that price (and within that bar) 21296 contracts traded. The existence of the yellow dot on the right only tells us that there were > 100 contracts traded at this price, with the size of dot conveying the relaitve size compared to other visible prices. The existence of the blue dot on the left tells us there was at least one trade with size > 100, while the number 23 tells us there were actually 23 trades > 100 in the composition of the 21296 contracts. The size of that blue dot reflects the total size of those 23 trades relative to the other visible blue dots. If you look at the red arrow, the yellow dot is missing because the total volume at that price is not > 100 (same at low price of same bar). Here is the chart definition for chart below: https://www.linnsoft.com/charts/td-sizefilters-es
Hi Chad,
thanks a lot for this crystal clear explanation - TradeDots such a nice feature, especially when when you start combining it with the volume candles, MPHs and PVPs .
Eddy..
Thanks for this thread.
I've only started reusing the Trade Dots thanks to the information here.
I have one feature suggestion for a future enhancement.
Where we are using the trade dots in this accumulated manner to identify large trades via big dots it would be great to have that "hover text" feature from the Price Volume Pattern ported over to Trade Dots so we could hover over a dot (eg and also holding down the CTRL key) and see the exact volume represented by the dot
Trade Dots with "Pixel per Volume" diameter set up
Hi,
I really like the visual aspects of trade dots when there are based on a "Pixel per Volume" diameter set up
This is really the best setting for visually spotting exceptional volumes event. However, sometimes big is to "big" and a re-scaling option for that setup would be very helpful.
For example, i want to display volume events having a typical size between 10 and 100 contracts but occasionally going up to 250. The lowest settings that i can use is 1 pixel/volume.
In that case, a "1/10 th re-scaling option" would be very handy so that the corresponding trade dots diameter would be between 1 and 10 pixels, with the rare "big" dots popping up at 25 pixels.
Thanks
Eddy
First, when reviewing this option, I realized that I titled this option incorrect. Instead of "Pixels Per Volume", it should be "Volume Per Pixel"....as it controls the amount of volume that each pixel (of diameter) represents. So in your situation, if you set to 2, then a price with volume of 50 should be 25 pixels in diameter. Agree?
Anyway, I assume you have explored the Low/Lower/Lowest Scaling options that are available? Those will essentially keep the biggest dots from getting too big, and give the smaller volume prices more diameter. But, I can certainly add a 1/10th scaling option ...that would just work off the 'proportional' setting, but divide diameter by 10.
Hi Chad,
thanks for the clarification - I have just been confused with the title
In my case, with "Volume per Pixel" at 4 or 5, it will work - No need to add any additional scaling option :-)
Cheers
Eddy
Exactly. When the Color Basis is set to Delta, and the dot is white (or matches whatever the background color of chart is), that is indicative of the bid volume being equal to the ask volume at that price.
Hi Chad,
could you give some information on the filter feature which was added to the trade dots RTX ?
While the filter option itself looks quite straight forward, I am not sure about the "Accumulate Filtere Trades" checkbox and what "Draw Trades as Text" would/should return
Thanks a lot
Eddy
The "Filter" works a little different depending on whether "Accumulate Filtered Trades" is checked or not. When not checked, it will filter the net volume at each price. If checked, it will filter ALL trades...and in that situation "Draw Trades as Text" is available which tells you how many trades happened at each price which met your filter criteria.
Essentially, when "Accumulate Filtered Trades" is checked, TradeDots then considers all trades within each price (within each bar), not just the cumulative volume at each price. In the chart below I've used VolumeCandles to show the volume at price as text and put 2 instances of TradesDots on either side of that text. On the left (in blue), "Accumulate FIltered Trades" is turned on, while on the left (yellow) it's turned off. Otherwise, settings are identical. I'm sing the button at top of the chart to control the volume size filter level, set to > 100 in this chart. So first look at the price pointed to with the blue arrow. At that price (and within that bar) 21296 contracts traded. The existence of the yellow dot on the right only tells us that there were > 100 contracts traded at this price, with the size of dot conveying the relaitve size compared to other visible prices. The existence of the blue dot on the left tells us there was at least one trade with size > 100, while the number 23 tells us there were actually 23 trades > 100 in the composition of the 21296 contracts. The size of that blue dot reflects the total size of those 23 trades relative to the other visible blue dots. If you look at the red arrow, the yellow dot is missing because the total volume at that price is not > 100 (same at low price of same bar). Here is the chart definition for chart below: https://www.linnsoft.com/charts/td-sizefilters-es
Hi Chad,
thanks a lot for this crystal clear explanation - TradeDots such a nice feature, especially when when you start combining it with the volume candles, MPHs and PVPs .
Eddy..
Thanks for this thread.
I've only started reusing the Trade Dots thanks to the information here.
I have one feature suggestion for a future enhancement.
Where we are using the trade dots in this accumulated manner to identify large trades via big dots it would be great to have that "hover text" feature from the Price Volume Pattern ported over to Trade Dots so we could hover over a dot (eg and also holding down the CTRL key) and see the exact volume represented by the dot
I will look into the possibility of adding Hover Text options for TradeDots.
Hi,
I really like the visual aspects of trade dots when there are based on a "Pixel per Volume" diameter set up
This is really the best setting for visually spotting exceptional volumes event. However, sometimes big is to "big" and a re-scaling option for that setup would be very helpful.
For example, i want to display volume events having a typical size between 10 and 100 contracts but occasionally going up to 250. The lowest settings that i can use is 1 pixel/volume.
In that case, a "1/10 th re-scaling option" would be very handy so that the corresponding trade dots diameter would be between 1 and 10 pixels, with the rare "big" dots popping up at 25 pixels.
Thanks
Eddy
Eddy,
First, when reviewing this option, I realized that I titled this option incorrect. Instead of "Pixels Per Volume", it should be "Volume Per Pixel"....as it controls the amount of volume that each pixel (of diameter) represents. So in your situation, if you set to 2, then a price with volume of 50 should be 25 pixels in diameter. Agree?
Anyway, I assume you have explored the Low/Lower/Lowest Scaling options that are available? Those will essentially keep the biggest dots from getting too big, and give the smaller volume prices more diameter. But, I can certainly add a 1/10th scaling option ...that would just work off the 'proportional' setting, but divide diameter by 10.
Hi Chad,
thanks for the clarification - I have just been confused with the title
In my case, with "Volume per Pixel" at 4 or 5, it will work - No need to add any additional scaling option :-)
Cheers
Eddy