Steve,
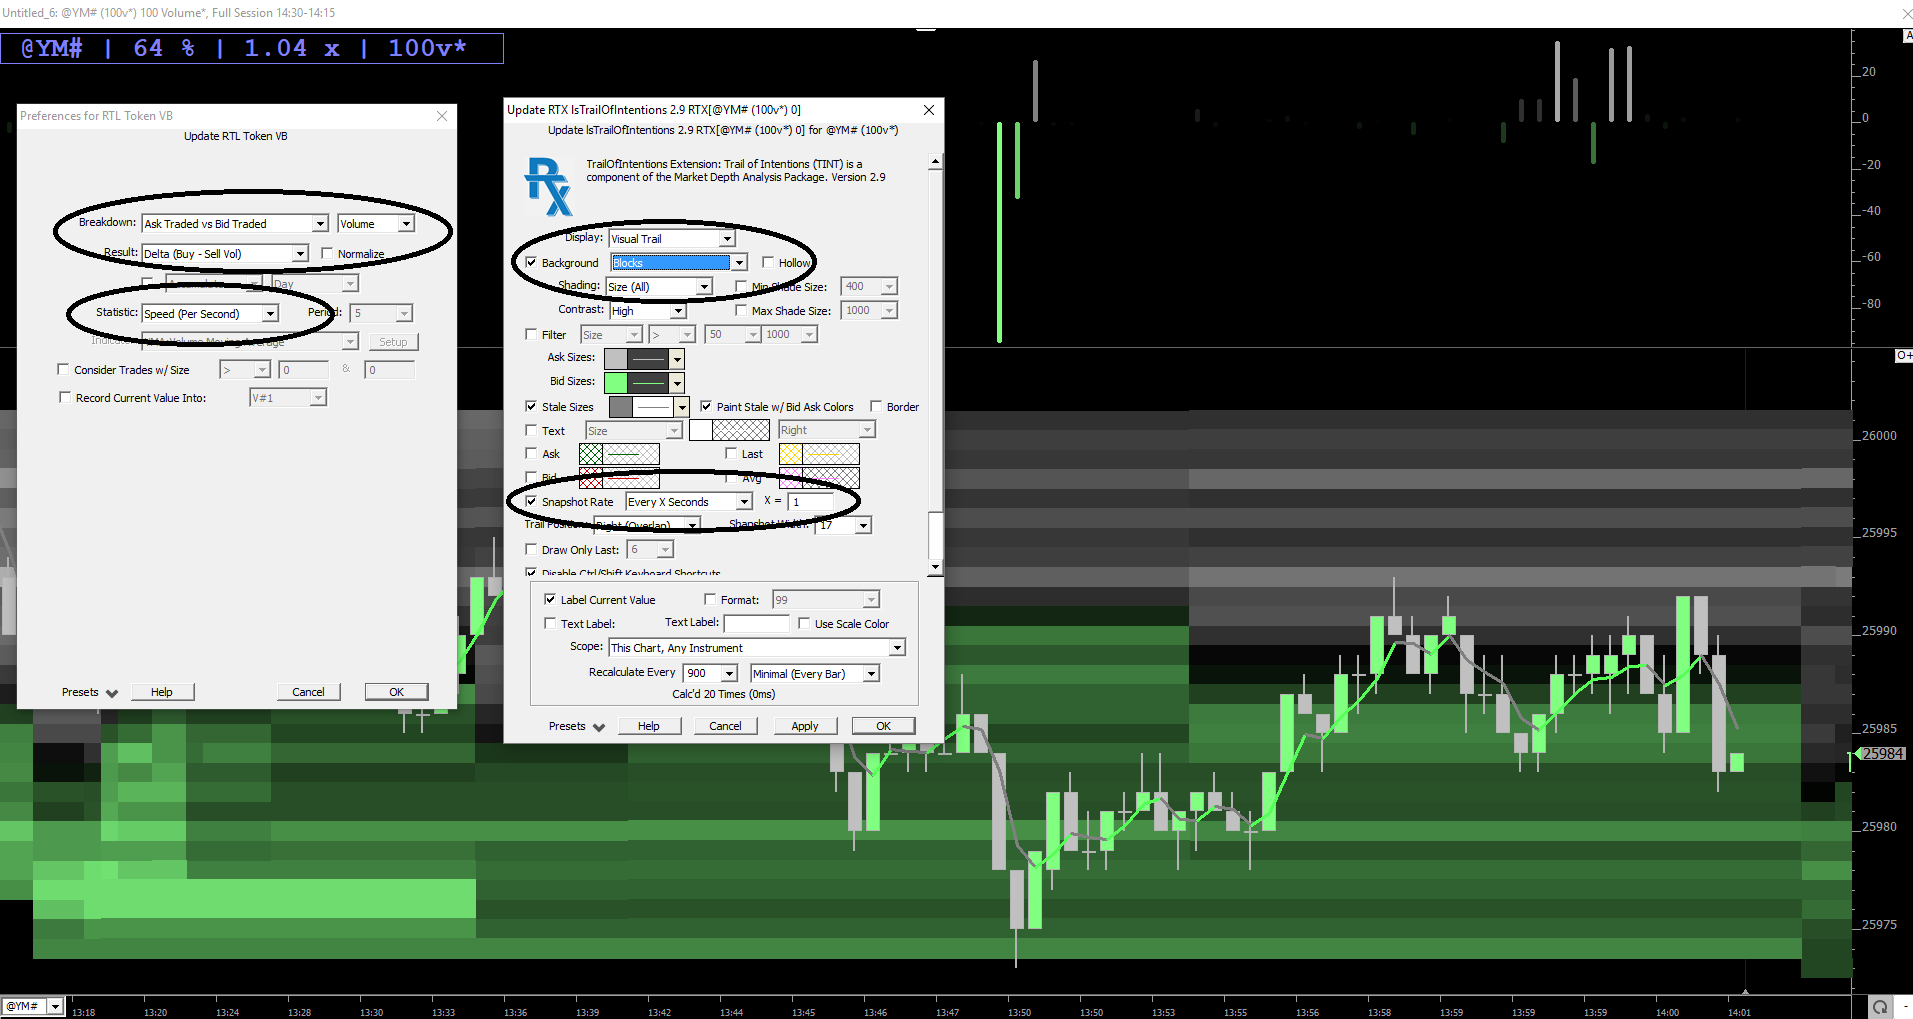
Volume Breakdown - Speed per second
I think, and apply, this result/statistic combo in the Volume Breakdown as my high frequency indicator. I use it to identify, and even discern the intent of, high frequency traders. It helps me to predict leading edge/very fast entry and exit points.
I think probably all high frequency traders have 1) Better information than me. 2) Can process and execute on that information faster than me. 3) Have deeper pockets than me. So, I like to know what (and where and when) they are up to.
(In truth, not all these spikes are technially HFT only traders. But no matter the trader type, all these spikes are picking up trades that are EXECUTED at a high frequency. It's just that thinking of this output in terms of HFT sort of makes sense and makes it easier to understand what it's telling you.)
You can pick-up the HFT guys by looking at a plain old 1-sec chart with raw volume. Just look for the spikes.They usually come in pairs and around relative highs and lows. But when you look at these spikes through the VB, you can accurately answer this question most of the time:
"Did HFT just buy or sell?"
What's SUPER important to understand about how I'm applying this result/statistic combo is that Buy = Bid and Sell = Ask. This is exactly opposite of how Buy and Sell is defined in the indicator settings. This is exactly opposite of how I normally apply VB, using the standard buy/sell definitions. But in my world, and in this HFT world, a trade at the Bid is a Buy and a trade at the Ask is a Sell IF AND ONLY IF it's done so at a very high rate and with LOTS of other trades with it, all within the same second.
You don't need to do anything to the indicator to switch the Bid/Ask and Sell/Buy definitions. But on my chart, you'll notice that volume at the Bid is green and green = Buy. Conversely, volume at the ask on my chart is gray, and gray = Sell. So --- LOL --- basically, whatever color you use for buy and sell, just swap those colors in this instance, and when applied to the VB indicator, in this way.
To really understand what this VB setting was telling me, I spent a lot of time watching it, alongside time and sales. Do this for a while and you'll see exactly what I saw and you'll learn how you can use this output to help make buy and sell decisions.
Look for the bursts of randomized 1, 2, and 3 lots, in your time and sales, like a string of 1, 2, 1, 1, 1, 1, 2, 3, 2, 1, 2, 1, 2, 1, 2, 1, 1, 2, 1, 4, 3, but ALL WITHIN THE SAME 1 SECOND TIMESTAMP. Only one type of trader in the world that's capable of doing these trades.
Lastly, I'm doing a tiny bit of pre-processing on this VB output, but you can use it right off the shelf and it works like I've described. Also, I'm running it through the Paint Indicator because I want to black out the smaller spikes that don't matter. The net effect on my chart is an even more non-linear look, than if I didn't use the Paint Indicator, and just used the VB off the shelf instead. It doesn't matter either way.
----
TINT - Trails
The periodicity of the TINT - Trails doesn't matter to me at all. And I change periodicity all day long. And keep in mind I'm using Volume periodicity. That chart of the YM is a 100 Volume periodicity.
THe periodicity does NOT matter to me because I'm using a 1-second snapshot rate. I think that's the more important decision up-front. Now, if you chose a snapshot rate of a bar completion, then it totally matters.
I've experiement with both and landed on the 1-sec snapshot because:
1. It adds more non-linearity to my output, which I love.
2. It just makes sense to me, in the way that I'm learning to use it, and it's all visual and subjective, and given the nature of the data -- it just makes sense to me to update as fast as possible.
3, I'm starting to connect relative volume to changes in the order book with the Trails. Visually. I'm learning how to perceive when the order book slows, when its changes slow, that's usually when volume tapers off, and price quiets down. Or, when volume starts to pick-up, I'm learning how to see changes in the order book, and when they start to pick-up, vis-a-vis the Trails.
And what's really cool: I don't have to spend a lot of brain power doing this. It's all visual. i'm finding that I can use my peripheral to follow a couple of markets pretty easily, minimal mental effort.
The painted horizontal bars, all the changes, the changing color gradients...it all gives more life to the chart, kind of like a heartbeat. And the rate of this heartbeat changes, and these changes are very useful pieces of information that I'm tying back to the market's mode and when it's changing modes, and I'm learning how to pick this up, and it's really cool.
----
Indicator parameters below. Highlighted the inputs that matter most to me. There's A LOT to this TINT and I'm only beginning to scratch the surface, so keep that in mind. I'm still pretty naive and ignorant about it all and only have a couple of weeks of experience applying in real time.
Would love to hear if you're picking up anything interesting with it.
I just found this approach and it mirrors what I have done in another way using
different indicators. I am currently building this chart, will run it alongside my 30 second chart. If you would like to chat via email, let me know
Al
I've been playing with this iteration of the TINT / VolumeScope
The bottom BSTAT window highlights lots <=10
The upper BSTAT is >10
If you take a look you can see an early delta shift from the 10 lots as the market approaches extremes.. This goes against the smaller crowd who I guess get carried away with momentum. When used in conjunction with the footprint fill data you can find moments where weak high or lows are put in and the larger traders move against it
The limited TINT gives some nice indication of large orderbook levels approaching, though I might try to run this chart side by side with a full TINT implementation
I'll also have a look at adding the VB you've got here - I see from you're research there may be occasions when the small lots know what they're doing!
Mitch
"I see from you're research there may be occasions when the small lots know what they're doing!"
When A LOT of small lots are executed in the same second, or millisecond, then they probably know what they're doing. And they are probably a very large trader.
In my opinion, in these modern electronic markets, large traders go to great lengths to disguise their size and intent.
Shoot, I even slice up my orders to hide from the market because if I don't, I usually get bad fills and its costs me money.
Here are 2 charts i use that help me a lot. !st is the 30 TINT chart which shows clearly in ES the increase in ticks / sec as we move toward the LOD. Notice the pace and then the bottom, this pattern occurs over and over.
The 2nd is the relative volume for today showing bog lot buying, yesterday was the same. This helps explain the progress for me, and the sustained selling pressure of small lots vs the big lots.
Rel Vol
That's a really cool implementation of ticks / sec!
You might find this relevant https://www.linnsoft.com/videos/consolidated-tape it's going to sort those small orders into batches
I'm looking for the 5-7 intraday pivot points and trading those with the order flow. I don't need the sorted DOM to show me that I run Jigsaw tools alongside my IRT charts, which are designed to show the pivot points and volume flow. The 2 charts posted give me an overview of the orderflow. I use JS with a reconstituted tape similar to the idea Chad was working on in the video you posted a link for. Perhaps he got the idea from JS.
The TINT chart again shows the same pattern approaching the 11:10 move off the lows today.