When I use the ZigZag Periodicity with UpTick DownTick Volume on the Volume Breakdown as well as the Instrument settings being Ticks not Bid/Ask. I then use a PVP setting of Bid=0 or ASK=0, I notice no matter what kind of market were in or instrument being looked at, there seem to be a lot more Asks that plot with zero than Bid. I assume this has to do with how the Zig Zag indicator builds the bars. These certainly aren't all market sweeps.... No other bar type tends to have this difference with the Bid vs Ask..... Can someone give me the mechanics of how those bars are formed?
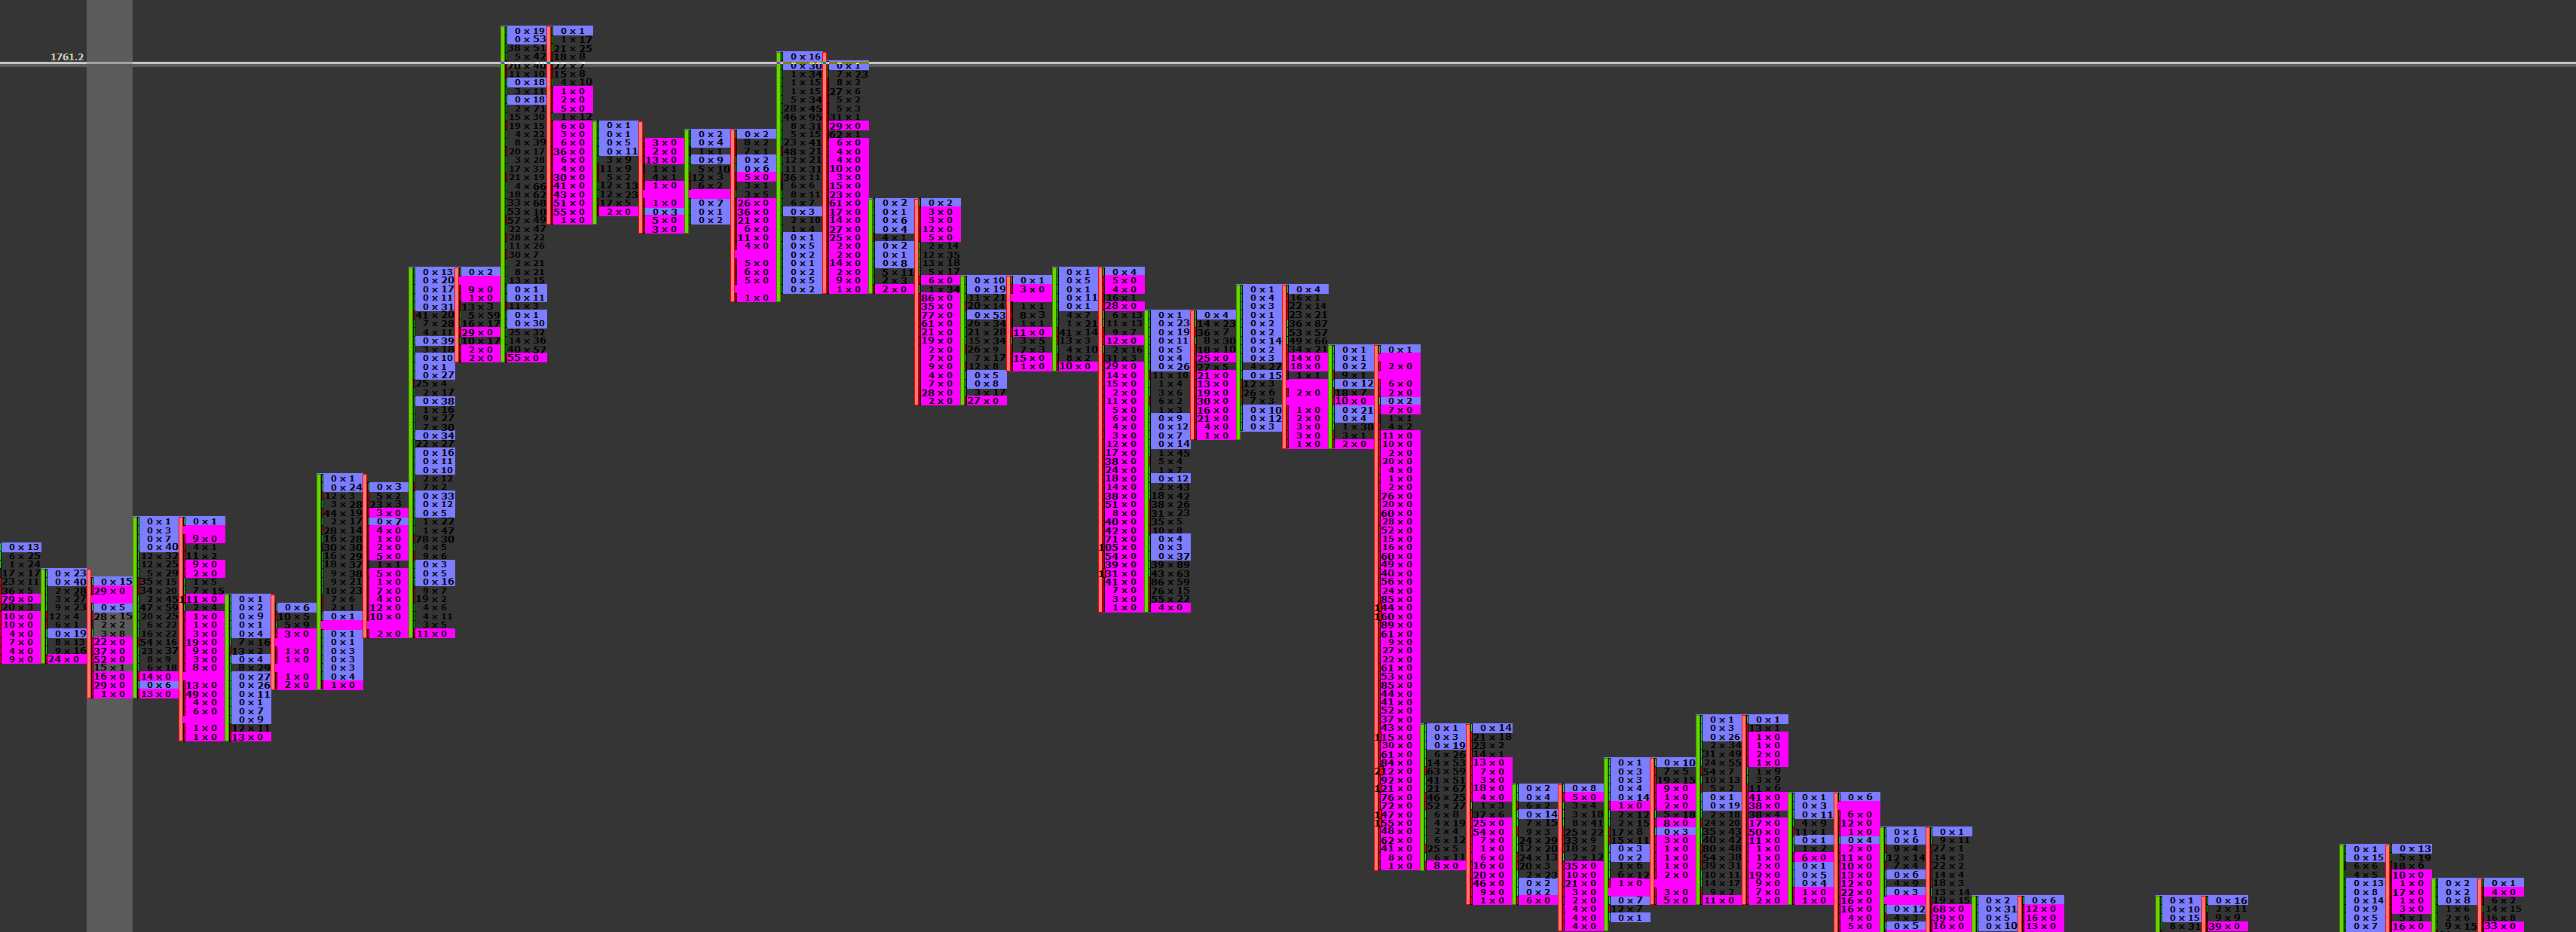
Here is another example of two bars with identical information, I plotted side by side, BidAsk on the left, and UpTick/Down/Tick on the right on a 10 Zig Zag Periodicity. Clearly you can see the different BidAsk information being plotted by the 2 different VolumeScope bars is different with the Ask being Zero in many of the price fields on the tick bar on the right. While the same exact information on the left with the bid ask bar is quite different on the left. I hope everyone understands what Im asking. In other words I have two ESZ3 bars with the same information, just plotted side by side on thee same chart... sorry to be repetitive.
I wanted to note that the reason I am asking this question is that I think this could be valuable information to know for downside pressure on the market..... I just need some clarity on how the bars are being plotted so I can figure out the "Why" of all the zero price plots. Tks!
Sorry to keep posting here, but I found this video explaining how the bars are formed.
https://www.linnsoft.com/videos/zig-zag-periodicity
I am still a little fuzzy as to how there are so many "Zeros" . I can clearly see that if you add the bid ask from the regular data from the bar on the left, it equals the ZigZag information, im just not sure how/why it all gets put on the Bid Side. Im sure Im missing it somewhere, tks for anyone who takes the time to look at it.
Hi Edward,
I have investigated your issue and I think I found your problem. I am using many zigzag bars and up/dn volume tick based indicators, but never encountered your specific chart configuration.
My guess (I would need your chart definition to be 100% sure) is that your issue is only a "display" issue linked to the fact that
1) you are trying to display on the SAME chart both Bid Ask and up/dn tick data.
2) you are not "aligning" both instruments, which seems to create, indeed, for the zigzag periodicity, some messy/incorrect bid/ask data display
To be 100% clear :
1) First, if you display 2 separate ES charts next to each other, both using a 10 tick zig zag periodicity and displaying the same VS and PVP indicators, but with one based on the bid/ask volume settings and the other based on the up/dn tick volume instrument settings, you should find out that both Volumescope data are fully consistent and do not include any abnormal number or zeros. (let me know if this is the case)
2) if you want to display both VS and/or PVP indicators on the same chart, it will only work if you check, for the second instrument, the "align with master" box (see screenshot below).
I have created an ES 10 tick zig-zag chart, with 2 volumescopes: one, on the left, being applied on a Bid/Ask volume ES symbol (the "master" instrument) and, on the right, one associated with the up/down volume based ES symbol. I have also applied the PVP indicator to the up/dn tick volume-based ES and it works perfectly fine to detect price levels with zero up or dn tick volumes.
Here is my chart definition :
https://www.linnsoft.com/charts/updnvsba-vs-and-pvp-es
Please note that, in that particular case, when you "align" the second instrument to the main one, it has a minor drawback. A discrepancy is happening at the open/close of each zig zag bar because the "instrument align" process is by definition not "perfect" in that configuration. It is not specific to zigzag bars, but it is a known limitation for all non-time based periodicities which can't "align" perfectly to the tick (on a single chart time scale) as IRT is not handling (in that align process) the millisecond time stamps for each tick data.
However, be aware this is just a "display" issue, this is not an issue related to the way zigzag charts (or other non time based periodicity charts) are built. As I mentioned earlier, if you use 2 separate charts (one based on an "up/dn tick volume" instrument setting and the other one on a bid/ask volume setting), then both VS will be 100% consistent, up to the single tick precision.
Cheers
Eddy
PS : do not hesitate to share your chart definition - It is always easier to find the issue this way.
PS(2) : welcome to the zigzag chart world - such charts provide powerful information for your trading, but it is critical to perfectly understand the way these bars are built and the time delay linked to the minimum reversal move amplitude required to have a "confirmed" historical zigzag bar, ie a bar that won't be modified anymore by upcoming new ticks.
If this is not yet 100% clear to you, you should put on the same chart a 10 tick zz bar and a 10 tick pnf bar, and also display, on a separate 1 tick periodicity chart, a ZigZag Oscillator indicator showing the "confirmed pivot price" (for a 10 tick ZZ range) as a stepped line.
I still remember the day (many years ago) zigzag bars became finally crystal clear when I finally understood that a 10 tick zigzag bar becomes "definitive" whenever a new 10 tick pnf bar starts to print, ie whenever the zigzag "temporary pullback" bar reaches a 10 tick amplitude and become part of the next zigzag bar...
That was it Eddy, I didn't have it aligned with the master. My data matched your chart exactly when I checked the box.... Not sure how that happened. Thanks for taking the time to look at this, it was bugging me with the disparity between Bid/Ask information on the dual instruments. I think I get the gist of the ZigZag bars, certainly nothing I would want to backtest with, but I still like looking at them in certain situations for after the fact.
I will say, I tried to load your chart multiple times with no luck, I attached what showed up on my end... It was the two instruments with no PVP or VolumeScope. Not sure if something is off on my end, but I load these charts all the time. I think I may have had this issue before, but strange, just thought I would mention.
tks again!
Edward01