Duration:09:20
Variable speed version:
Watch
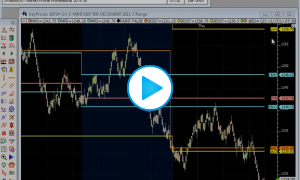
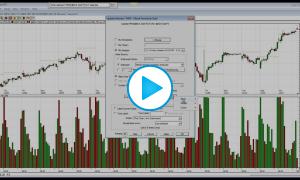
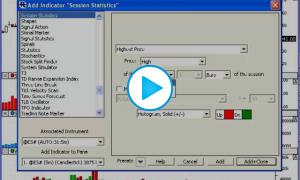
This video details how to use a combination of the MPD and Session Statistics Indicators to plot the overnight high and low historically on a day session chart. It also documents a more complex requirement of plotting the high and low of a subset of the overnight period (1am to 8:30am ET) on a day session chart.