Duration:34:38
Variable speed version:
Watch
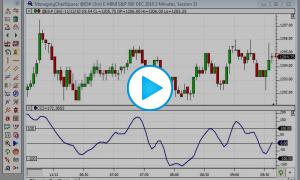
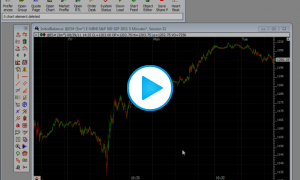
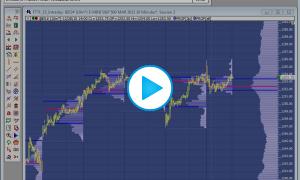
This video below demonstrates how to plot reference lines on multi-pane charts for various key time-sensitive prices including the previous session close, the current day session open, the overnight high and low, the opening range (OR), initial balance (IB) and several IB multiples. These concepts can be used to plot a variety of similar time-sensitive prices on charts of any periodicity and any session. The video covers various concepts including user variables, custom columns, custom indicators, and reference lines. Important chart definitions associated with the video: Chart Definition Quotepage Definition