Exporting and importing Charts
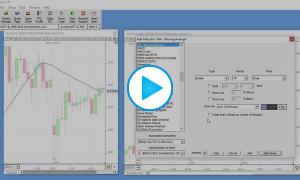
How do I Import or Export a Chart Definition?
How do I Import or Export a Chart Definition?
Introducing the pane "hot spot" interface: getting easy access to both the Pane Element Menu and Chart Element Manager
This video provides several tips and shortcuts that make creating Investor/RT charts quick and easy. Version 12.5 is used for this video.
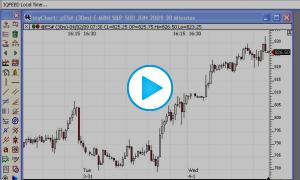
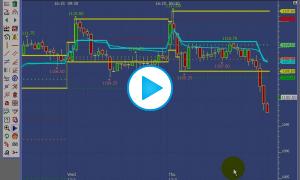
This video below demonstrates how to plot reference lines on multi-pane charts for various key time-sensitive prices including the previous session close, the current day session open, the overnight high and low, the opening range (OR), initial balance (IB) and several IB multiples. These concepts can be used to plot a variety of similar time-sensitive prices on charts of any periodicity and any session. The video covers various concepts including user variables, custom columns, custom indicators, and reference lines.
This video discusses the important basic elements of traditional multi-pane charts including creating charts, changing the symbol or periodicity, and sharing charts.
This webinar covers the following topics:
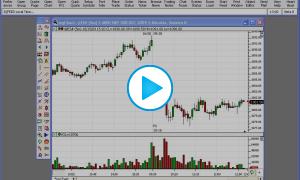
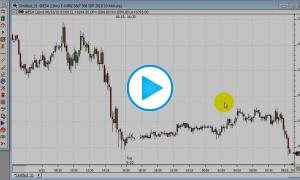
This video describes how to create a more pronounced line separating the sessions in a multi-pane chart.
This video explains how to draw vertical bands or strips across the entire width of multi-pane charts.
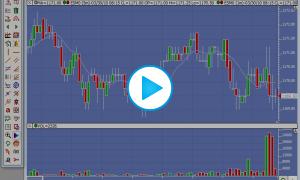
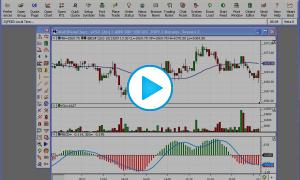
This video covers many aspects of customizing multi-pane charts including colors, periodicity, symbol, scaling, scrolling, and much more.