See Also: Three Line Break Charts See Also: Processing Data for Three Line Break Charts See Also: Three Line Break Preferences See Also: Three Line Break Indicator Note: This tutorial could also apply to PNF by simply replacing PNF for TLB throughout the tutorial
This Tutorial series will discuss several different ways of using Three Line Break methodologies within Investor/RT, including...
- The TLB token and it's options
- Using the TLB token within a Custom Indicator
- Using the TLB Custom Indicator within a Custom QuotePage Column
The TLB token and it's options
First, let's take a close look at the preferences for the TLB token, available in building Custom Indicators, Scans, and Trading Signals.
TLB Token Preferences

Column Data Elements

Price Options

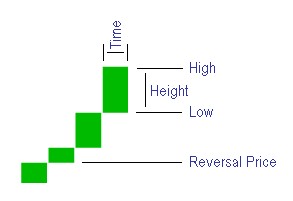
Column Data Elements This options dictates what the resulting value of the token will be. Below is an explanation of the column data elements, along with an illustration that shows visually what the elements represent.
| High | High price of the TLB column. |
| Low | Low price of the TLB column. |
| Height | Height of the TLB column, or High - Low. |
| Rising? | Is the column in a rising or falling state.If it is rising, the result will be TRUE, which numerically is represented by a 1.If it is falling, the result will be FALSE which is numerically represented by a 0. |
| Time(secs) | The time, in seconds, that has been spent in the column. |
| Reversal Price | The price that is required in order to create a reversal. |
Use Last ___ Bars
This option dictates how many traditional bars of data will be loaded when computing corresponding data element. TLB is a cumulative indicator, and can have slightly different results when the data used to compute it begins at a different starting point. The larger the number used here, the more reliable the results, but in turn, the more processing power needed to compute. A good recommendation for this setting is 300 bars.
Price
These options dictate the data that will be used as input in computing the TLB values, and the order the data will be processed. If the first option "Use Highs and Lows" is selected, the data will be processed based on an algorithm described in Processing Data Feature. If the second option is selected, then the corresponding price data of each traditional bar will be used as input for computing the TLB data. The price options are shown in the illustration above.
Expand Into Traditional Bar Data
This option causes the TLB columns to be expanded or stretched in order to conform with the underlying time-based traditional bar data. If this option is left unchecked, then the TLB indicator columns will not necessarily match up with the traditional bars. The feedback in the title bar will indicate the time or date that each TLB column ended. Checking this box will cause each TLB column to be stretched out over the period of time which was used to create the column. Some TLB columns may encompass only one underlying traditional bar, but more than likely, a column encompasses many bars. By checking this option, the TLB results will be stretched out to give a value for each of the corresponding traditional bars.
In the two examples below, the left chart shows the TLB indicator with the "Expand" option check, while the right chart has this option unchecked. As you can see, the same columns seen in the chart on the right, get expanded, or stretched, over more traditional bars in the chart on the left. They are being stretched over the bars in which the TLB remained in that column.
Expanded Into Traditional Bars Data

Not Expanded Into Traditional Bars Data

Let's now move on to Creating a Custom Indicator using TLB
If you have any questions concerning the above description, open a support ticket.