Drawing Tool

Spirals (Logarithmic Spirals)

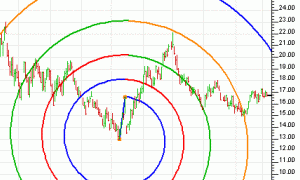
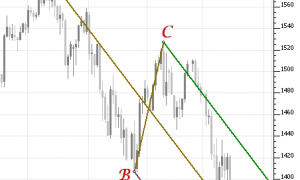
The Spiral indicator (also know as the "Logarithmic Spiral") provides a link between price and time analysis, and can help in forecasting both price and time. Similar to indicators such as Fibonacci Retracements, Fibonacci Arcs, and Gann Angles, the Spirals indicators is based off a trendline which connects a significant high with a significant low. The spiral can be drawn in a clockwise and/or counter-clockwise direction originating from the endpoint of the trendline.

Reference Line

The Reference Line indicator draws a horizontal line on the displayed chart according to the preferences of the user. The line can be drawn according to a trading value on a particular day, an alarm value, or an arbitrary value of the user's choosing. This tool may be used repeatedly to overlay several reference lines on a given chart. Using the mouse you may drag a reference line to adjust its reference value . The value is based upon where the tip of the mouse is positioned when you "drop" the reference line.

Rectangle Drawing Tool

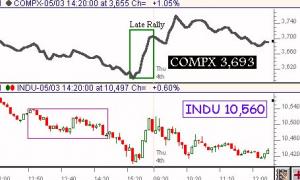
The Rectangle tool is a chart drawing tool used to highlight a user-specified range of time in the chart by enclosing that portion of the chart inside a rectangle. Rectangles may be drawn in chart windows of any periodicity. Activate the rectangle drawing tool by clicking on the rectangle tool in the chart toolbar. Move the mouse pointer into the chart window (the cursor changes to a pencil). Push down the mouse button and drag the mouse to form a rectangle that encompasses the period of time you wish to highlight.

Profile Indicator (PROF)

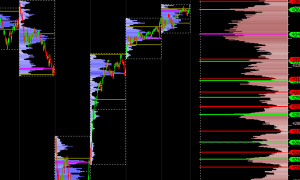
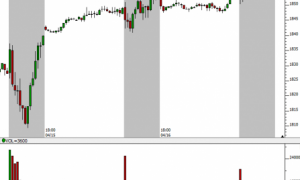
The Profile indicator enables the user to overlay a price-based profile over a multi-pane intraday chart. The Profile provides a "Price/Row" preference which dictates the height of each row. The width of each resulting row will represent how many bars during the session in which that row's price range was touched. If the periodicity of the chart is 5-minute, and the width of a row is 3 bars wide, then the range of three of the 5-minute bars for that session actually overlapped the price range of that row. The widest row is called the Point of Control (POC). The Value Area (VA) is commonly considered the area in which 70% of the price action transpired. This percent level is adjustable, as some prefer to use alternate VA % levels such as 80%. Options for drawing the current and previous POC and VA lines are provided in the Profile preferences. Another option dictates how many sessions for which the Profile will be computed and displayed. The Profile may be drawn as Solid or Hollow Blocks, Solid or Hollow Ovals, Dots, or Lines. A "Hide Profile" checkbox gives the user the ability to hide the actual profile and draw only current and/or previous POD and VA lines. The "Current" and "Previous" POC and VA lines are also optional, as well as VA and POC labeling.

Andrew's Pitchfork

Andrews' Pitchfork is a line study consisting of three parallel trendlines based on three user selected points in time. This tool was developed by Dr. Alan Andrews. This upper and lower tines of the pitchfork provide support and resistance levels.

Paint Bars

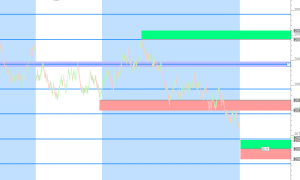
The Paint Bars indicator is a powerful tool for Painting the Bars or the chart background different colors based on True or False conditions. The "condition" can be tested for True or False by either a Scan, Trading signal, Custom Indicator, Plugin Indicator or by simply testing if the current bar is inside or outside of a particular Session. For each bar in the chart, a scan or trading signal is either TRUE or FALSE. You can choose specific colors for both the true condition and the false condition.

Info Box

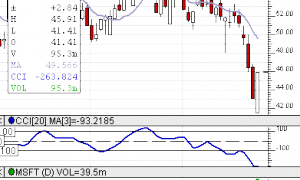
Info Box is a chart drawing tool that provides a tabular display of an instrument's market data and optionally, the values of technical indicators present in the chart window. User preferences are provided for background and text color, text font and size. The height of the info box is determined by the software based on the content requested. The width of the info box can be specified by the user in the preferences and can be adjusted using the keyboard. The market data displayed can be for:

Gann Lines and Gann Angles

William Gann (1878-1955) developed a unique combination of geometric and mathematical principles, which he applied to trading stocks and commodities. The proportional relationship of time to price was the basis for much of Gann's work. Price and time come together in Gann angles, which project trend lines from important tops or bottoms. All of Gann's angles are quoted in price to time relations, (i.e., 1 x 8). Translated, this means move 1 unit of time to the right and 8 units of price, up or down. The angle representing price and time in balance is 45 degrees (1 x 1, price to time).

Fibonacci Retracements (FIBR)

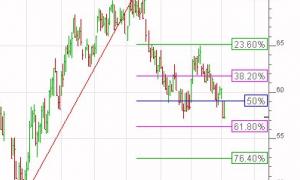
The Fibonacci Retracement / Expansion study is a very flexible tool in Investor/RT, allowing for drawing of both retracement and expansion lines, based on either price (horizontal), time (vertical), both. The Fibonacci trendline endpoints can be automated, can be user specified, can snap to extreme prices, or can even be set automatically to any custom value using a scan. Over 16 custom retracement/expansion levels can be drawn with each instance of the study. The price retracements can be based on either % levels, or absolute price ($).

Fibonacci Projections

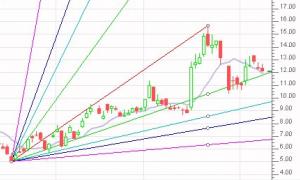
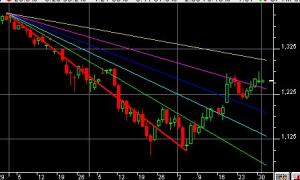
Fibonacci Projections, or Fan Lines, are displayed by drawing a trendline between two extreme points, for example, a trough and opposing peak. Then an "invisible" vertical line is drawn through the second extreme point. Three trendlines are then drawn from the first extreme point so that they pass through the invisible vertical line at the Fibonacci levels of 23.6 %, 38.2 %, 50.0 %, 61.8 %, 76.4%, or whatever customized levels you prefer.

Pages