Drawing Tool

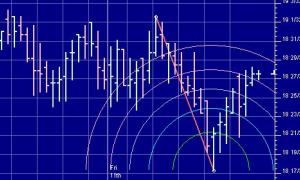
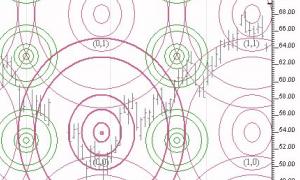
Fibonacci Arcs

Fibonacci Arcs are displayed by first drawing a trendline between two extreme points, for example, a trough and opposing peak The arcs are drawn, centered on the second extreme point, so they intersect the trendline at the Fibonacci levels specified. The interpretation of Fibonacci Arcs involves anticipating support and resistance as prices approach the arcs. A common technique is to display both Fibonacci Arcs and Fibonacci Fan Lines and to anticipate support/resistance at the points where the Fibonacci studies cross.

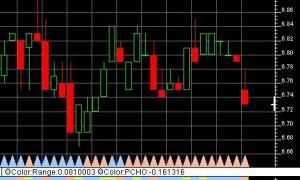
Color Marker Indicator

This indicator provides a flexible, colorful, compact method for displaying signal markers on charts. The signals can be based on the results of either Scans, Trading Signals, or Custom Indicators. For Scans and Trading Signal, color options are given for both TRUE and FALSE results. For Custom Indicators, color options are given for three different user specified price ranges. Four shape options are currently available, including rectangle, oval, up arrow, and down arrow. The color marker for each bar has the same width as the bar.

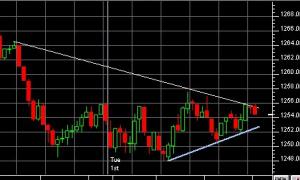
Automatic Trendlines

The automatic trend line indicator determines the current up trend and down trend line and draws them. Trend lines may also be drawn manually using the drawing tool on the charting toolbar, but this indicator does it automatically. The user specifies the number of periods to "look back" from the present to determine where to place the trend lines. The up trend line connect the lowest low in the user specified period with the next lowest low preceding the highest high for which the trend line is not penetrated.

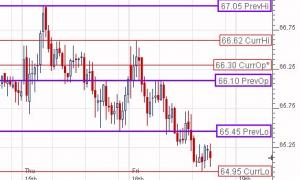
Bar Lines

The Horizontal Reference line tool has an option entitled "Bar Lines". This option gives the user an automated tool that draws horizontal reference lines at 6 levels: current open, current high, current low, previous open, previous high, previous low. This option comes with a periodicity control that dictates the periodicity of the bars used to determine the current and previous levels. For instance, if you specify a periodicity of "Daily", then your previous open will be the open of the previous day, and your current high will be the high of today.

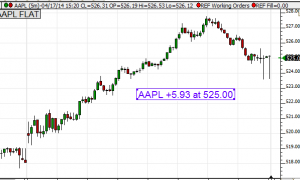
Annotation (NOTE)

The Annotation tool is used to place text notes or markers on charts. The chart toolbar has a button depicting the letter a for annotation. Click the annotation tool button and the cursor changes to a pencil. Move the mouse to the spot in the chart where you wish to place a textual annotation. Click the mouse and a text entry box will appear. Type in the text and press return. The new Text tool creates an "Annotation" indicator. The annotation indicator has been a part of Investor/RT for a long time but adding annotations has never been this easy.

Shape Indicator

The Shape indicator is a drawing tool indicator with a button on the chart toolbar to faciliate drawing shapes at the desired location in the chart. The button depicts a red square and a blue circle. Click the toolbar button to activate the drawing tool; the cursor will change to a pencil. Drag a rectangle encompassing the region where the Shape is to be drawn. Once the Shape is in place, it can be moved by dragging the small dot which is either in the center, or lower left corner of the shape (depending on whether Center on Coordinates is checked in the Shape preferences).

Pages