Tutorial - Alerts QuotePage Format
This Tutorial will be helpful in the following areas...
This Tutorial will be helpful in the following areas...
This indicator allows the user to calculate a variety of statistical results for any quotepage list of symbols, on any available technical indicator. The current list of available statistical results include Average, Sum, Maximum, Minimum, Percent of Average, Percent of Total, Percent Difference from Average, Relative Strength, Instruments with Data (Bars). For instance, you can calculate the average volume for a quotepage of symbols that contains the Nasdaq 100. You can calculate the average percent change on a quotepage that contains the S&P 500. You can calculate the maximum, minimum, average, or total spread on a quotepage that contains all optionable stocks. You can calculate the average (maximum, minimum) MACD (RSI, CCI, FASTD) for a quotepage that contains the DJI 30. You can calculate how many instruments in a quotepage evaluated TRUE for a given condition (using scan as the indicator). The possible combinations are expansive. As this indicator can be added to a chart, these values can be seen historically for all of the past bars. In order for this to work accurately, you must ensure that you have complete data on each of the symbols in the quotepage. You can verify this after adding the QuotePage Statistic indicator (QStat) to your chart by pointing to each bar. The feedback you see for each bar in the pane title for QStat will show how many symbols in the quotepage had bars on file for that time slot.
Investor/RT maintains more than 100 data items for each instrument, depending on the data service in use and type of instrument (Stocks, Futures..)
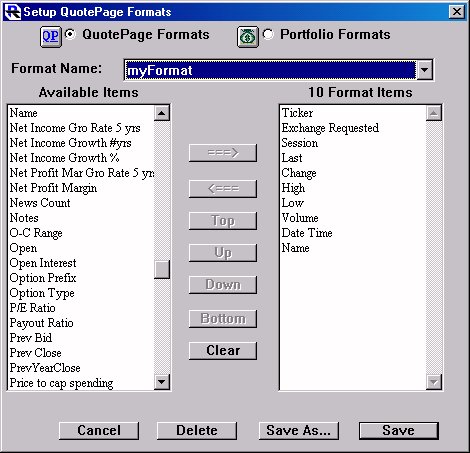
There are a number of format parameters that can be adjusted using this window. The window can be displayed via the Setup Preferences or from within a quote page.

The first few selections allow you to adjust the quote page color.
"Background Color" refers to the window color behind the numbers and text.
See also this introduction video Custom Quotepage Columns
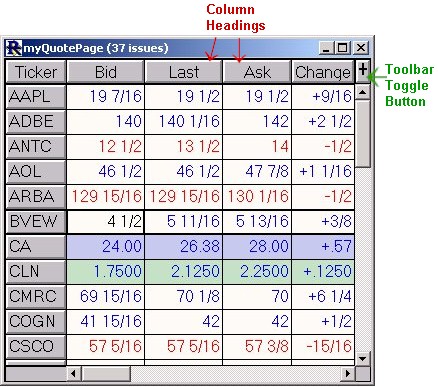
This tip will cover QuotePages. QuotePages are spreadsheets in Investor/RT designed to display information for a list of securities (instruments). Each row represents an instrument or ticker symbol, and each column represents a piece of data associated with the instrument. QuotePages are powerful tools for displaying large amounts of dynamic data in one table. QuotePages are also used throughout Investor/RT to provide a way of grouping instruments. For instance, QuotePages are used as inputs for Scan, in order to communicate to the scan which list of instruments it should operate on.