How can I plot the volume (range) relative to the average of the same bar (time) over past days or session?
This be done with the Session Statistic Indicator
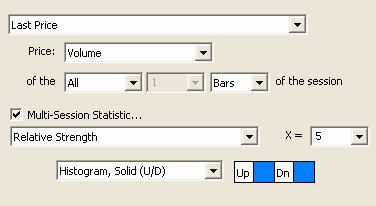
As an example, if you setup Session Statistics like the below:
This be done with the Session Statistic Indicator
As an example, if you setup Session Statistics like the below:
Painting the Overnight Session Background
Yes, here is a video explaining just that.
Price labels are drawn using the font size selected for the scale. The scale font defaults to "small" by default. To view the font size for any scale, double-click in the price scale area at the right of the pane. The font size options are small, medium, or large.
If you would prefer that all price labels be drawn in small font, regardless of the scale font setting, go to Setup > Configuration and set the variable
LargePriceLabels=false;
If the trade occurs at or above the ask price, it is considered a buy (ask volume). If the trade occurs at or below the bid price, it is considered a sell (bid volume).
If a trade occurs at a price between the bid and ask price, then by default, the following logic is used. If price just moved up on this trade or the previous trade, it's considered a buy. If price just moved down on this trade or the previous trade, it's considered a sell.
When a futures symbol rolls over to a new contract, a gap is created at the exact time of the rollover.Looking at a specific example, below is a chart of the continuous contract the S&P mini contract (@ES# using DTN IQFeed). This continuous symbols follows one contract right up until the time of rollover, then immediately switches to follow the new front-month contract.
The TPO Indicator can be used to plot lines for the developing VPOC as well as the developing VAH and VAL. The preferences below were used to result in the lines seen in the chart at the bottom of this page. Be aware that this indicator uses a little more memory than most indicators so try to use it on charts with smaller view periods (last 10 days or less) if to minimize the memory requirements (although adding it to a "last 100 days" chart only takes 6mb of memory, so if you have plenty of memory, not a concern).
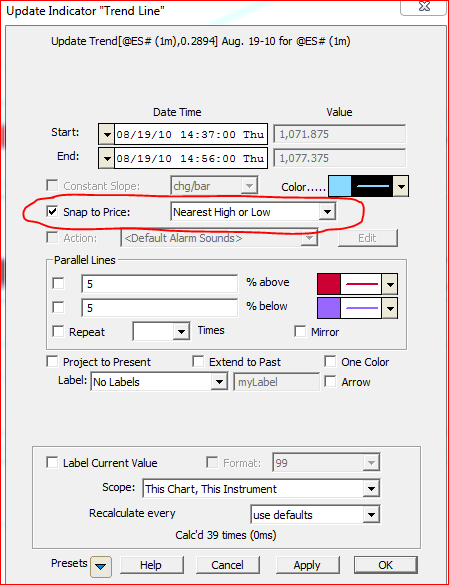
Yes, simply setup the Trendline with "Snap to Price: Nearest High or Low" as seen in the trendline preference window below. This option is the first option in the drop down list box. When trendlines are setup in this fashion, they will snap to the nearest high or low of the bar to which they are dropped or dragged.
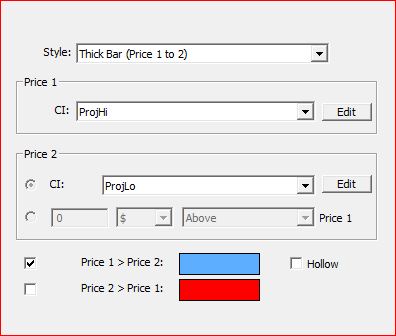
First, create a custom indicator called ProjHi with this syntax (LO + MAX(HI.1 - LO.1, 2)) * (POS = 1) where POS is setup as "bars from end of data"
Then create another custom indicator called ProjLo with this syntax (HI - MAX(HI.1 - LO.1, 2)) * (POS = 1)
Now, add the Price Bands Indicator to your chart, setup as follows:
In 10.4, a new option was added to the TPO Indicator titled "Compute Only Last X Days". If this option is not checked, the TPO Indicator will default to show the last 10 days/profiles. If the user wishes to show more or less days, he may check this box and specify the number of days desired up to 120. This option was added for efficiency purposes. It can take several seconds longer to initially compute the TPO Indicator for longer durations than short ones.
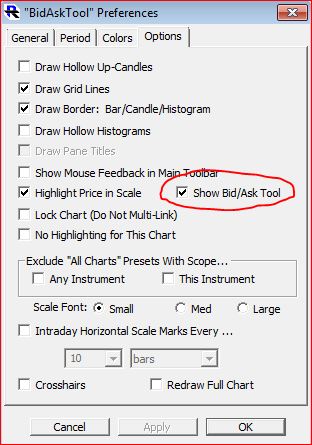
The Bid/Ask Tool is available to all multi-pane bar/candle charts. To turn on the Bid/Ask tool, bring up the chart preferences (by double-clicking in time scale at bottom of chart) and navigate to the Options tab. The checkbox is circled in red below.