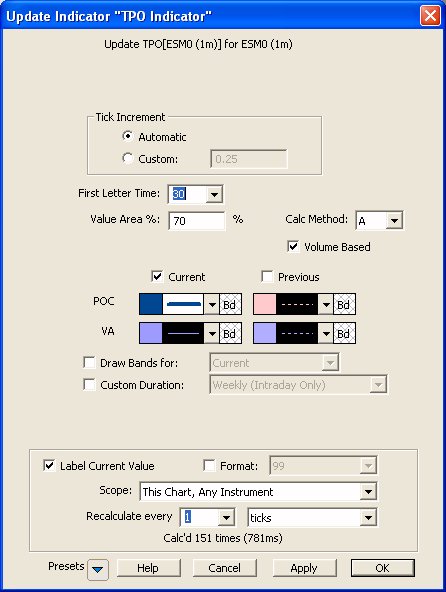
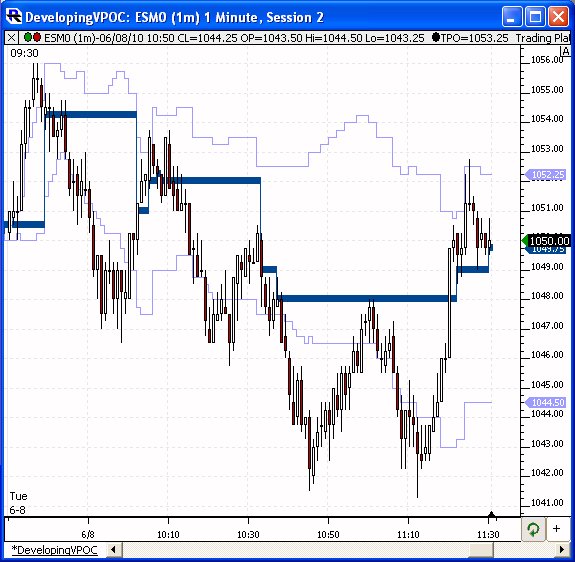
The TPO Indicator can be used to plot lines for the developing VPOC as well as the developing VAH and VAL. The preferences below were used to result in the lines seen in the chart at the bottom of this page. Be aware that this indicator uses a little more memory than most indicators so try to use it on charts with smaller view periods (last 10 days or less) if to minimize the memory requirements (although adding it to a "last 100 days" chart only takes 6mb of memory, so if you have plenty of memory, not a concern). If you wish to hide the VA lines, it's best to make them 1 pixel thick and "dotted" and set them to same color as background color of chart.