Investor/RT Version 10.5 Release Notes
Released: May 21, 2012
- New Indicator: Multiple Price Highlighter
The Multiple Price Highlighter Indicator (MPH) is designed to identify multiple prices within any given bar that present various volume-based characteristics. For example, the user many choose to identify the prices in each bar for which volume traded over 1000 contracts by specifying "Highlight Prices With: Volume: Above X: X = 1000. Alternatively, users can identify prices with volume Below X, Highest X Prices, Lowest X Prices, Highest X% of Prices, and Lowest X% of Prices. When user specifies "Highest X Prices" with X = 3 for instance, 3 prices will be highlighted in each bar which represent the 3 prices in the bar with the highest volume.
User may also choose to highlight bars with the Keppler Volume Tracker (KVT). This indicator was developed by Dr. John Keppler. The logic behind this indicator is proprietary but is designed to identify relative high volume prices taking into consideration the time of day. The two KVT Multipliers default to 10 and 20 and are used to adjust the sensitivity of KVT. The number of days specified tells KVT how far to consider data when determining relatively high volume. The user must ensure that the view period of the chart is greater than the number of days specified and that data is present for more than that number of days.
- eSignal Extended Historical Data Now Supported

eSignal users who have signed up for eSignal's extended historical data can now access longer term tick data and one minute interval data. eSignal reports that the extended service allows users to access 12 years of minute-based bar data for North American equities and indexes, and 2 years of North American, European and Asian futures, Forex and treasuries. The new extended historical data will be especially helpful to back testers who require large amounts of historical data to track the performance of their strategies across all types of market patterns and conditions. Tick data, normally limited to the most recent 10 trading days, is now available for the last 40 trading days. Minute interval data, normally limited to the last 120 trading days is now available for 2+ years back. To support longer term downloading of extended historical data, Investor/RT will download and import the data in incremental segments, the most recent data arriving first and subsequent segments bringing in increasingly older data. A 30 day tick download may result in say 10 segments, the first arriving fairly quickly updating the chart(s) with the most recent 3 days or so of ticks and the next 9 segments bring in another 3 days of older ticks. This is an improvement over version 10.4 where Investor/RT would collect all the data for the entire download before importing any of it and updating the charts. The charts will fairly quickly reflect the most recent trading sessions and be usable while additional segments of data arrive incrementally. A configuration variable kConfigUL_eSignalChunks, set to 2 by default controls how much data is downloaded before importing a segment. The setting of 2 allows current and prior session tick data to be downloaded as a single segment; double the setting to 4 to increase the segment size for example. This will increase the time it takes to get the first segment of a long term download, but will result in fewer segments overall as the download proceeds.
- Range, Change, Renko Periodicity Expressed in Tick Increment Units
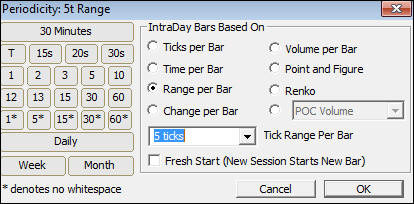
Investor/RT has long supported range bars, change bars, and Renko bars. Each of these periodicities is specified along with a numeric price range, or change amount, or box size in the case of Renko bars. The numeric amount specified has heretofore been expressed as an absolute amount, e.g. a 1.0 Range Bar periodicity for the ES futures represent a range of 5 trading prices in the ES contract. Because ES trades in .25 increments each range bar will include all trading at 5 distinct prices (the opening price of the bar plus 4 other prices above or below that opening price. Changing a 1.0 Range Chart from ES to some other futures contract that trades in .01 increments would produce range bars that span 101 trading prices due to the smaller tick increment. This is seldom the desired result.
In version 10.5 Range and Change amounts and Renko box size can be expressed in terms of a whole number of trading prices for the underlying future. The range and change amount is determined from the tick increment of the futures, i.e. changing a chart from one type of future to another will adjust the range amount automatically based on the tick increment of the future. For the ES contract, for example, if you specify a 5 tick range this means that each range bar will include trades at 5 distinct prices and will therefore include a 1.0 amount of price range. In general, if N is the tick range/change then the corresponding amount of range change will be (N - 1) times the tick increment of the future. If a future has display format 99.99 a tick increment of .01 is implied, thus a 5 tick range or change bar will include a price range of (5 - 1) times .01 which equals .04. Version 10.5 allows you to specify periodicity in absolute terms just as 10.4 does, by including a decimal in the periodicity entry. Using the Periodicity selection window, if you choose Range Bars and specify 1.0 you get a price range per bar of 1.0. If you specify a whole number, say 5, as the range without the decimal point, Investor/RT will give you a 5 tick range bar, i.e. a range bar that includes 5 distinct prices of the associated instrument. When upgrading to 10.5 all existing setups will continue to be price value range/change/box size. For example an ES chart might show 2.0 Price Range Per Bar in the Periodicity Window. You can replace 2.0 with 9 to get the equivalent 2.0 range expressed in tick prices, i.e. 9 distinct prices at .25 increments from the opening price of each range bar.
- Multi-Session Intraday Periodicity
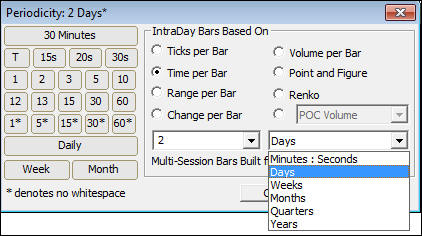
In the Periodicity window, the Time Per Bar option has long been used to specify some number of minutes and seconds, the constant duration of each bar formed from the underlying intra-day data. Time intervals have been limited to a span of time of at most one 24 hour trading session, e.g. 405 minutes for a 6.75 hour day session, or 1425 for a full overnight session (1440 minutes is 24 hours, less 15 minutes for inter-session break). In version 10.5 when Time Per Bar is selected, a units menu button is provided. Normally it will show Minutes : Seconds and the time interval is specified in the usual way. The units button also includes choices for days, weeks, months, quarters, and years. When one of these units is chosen, Investor/RT will accept a whole number of units, e.g. 1 week, or 3 days, or 3 months, or 1 quarter. These time interval periodicities, unlike normal daily, weekly, monthly charts in Investor/RT, will use intraday data as the source for constructing fixed time interval bars. The use of intra-day historical data to construct multi-session interval bars makes it possible to employ full overnight session intra-day data to construct say a weekly chart of just the day session hours. Investor/RT will consider only the intra-day ticks and bars within the day session hours when the chart calla for a day session override. A 1 day chart constructed from overnight session data will show the OHLCV for the full trading session, override to the day session to then see OHLCV bars for each day considering only the trading that occurred in the day session hours.
- VWAP Enhancements
The VWAP Indicator has been enhanced to allow the user to automatically chart the weekly VWAP. In the process of adding this option, several other custom VWAP durations were all consolidated to a single listbox. These options include: Weekly, Cumulative From Date/Time, Composite Average (All Data), First X Minutes of Session and Last X Minutes of Session. With the new Weekly VWAP options, users can now see the developing weekly VWAP historically on their intraday charts. Also a "Time-Weighted" option has been added to the VWAP Indicator. When this option is checked, the indicator will give equal weighting to each price if each bar instead of using the volume of each price. The Time-Weighting option is more of a TPO-based approach similar to what is used in TPO Profile charting.
- Extended Naked Fractals
The Fractals Indicator identifies key relative highs and lows. An option has been added to the Fractal Indicator to allow users to extend these naked highs and lows until they are touched by a future bar. The user may specify the color, width, and style of these extension lines with different color for the highs and lows. The user may also specify whether to extend all fractals, the last x fractals, or all visible fractals. The fractal indicator can also be added to indicator panes such as the cumulative delta implementation of the Volume Breakdown indicator. This new feature can help users identify divergence and levels of divergence between price bars and indicator bars or values. A check box was also added to the Fractal Indicator titled "Hide Fractal Markers" which gives the user the ability to hide the markers while showing the extended naked lines.
- Retracement Bands
The Bands Indicator now has an option for "Retracement Bands" with up to 12 retracement levels and colors. Within the Bands Indicator is an option for "Compact Band" style. The Compact Band draws a small band of user specified width along the right edge of the chart between the values of two user-specified custom indicators. The ability to specify the width of the band is also new in 10.5. The indicators can identify key prices such as session high and low, B high and low, previous session high and low, weekly high and low, etc. When the compact band option is specified, a "Retracement Band" check box is presented. When checked, the user is then given the option to specify up to 12 retracement levels, each with it's own color. These retracement levels are specified in % retracement. A 100% band would match the original band. A 150% band would extend the original high and low by 50% of the range of the original levels. A 200% band would be a full extension of the range in both direction. A 50% band would draw a small line at the center of the range. Labels can be placed over the compact band or in the scale providing either the retracement level or price of the band. If multiple compact bands are added to the same chart they will automatically be stacked side by side.
- New Options for Quoteboard Indicator
Two new options have been added to the quoteboard indicator. A "Hide Quoteboard" check box has been added to allow the user to plot lines/levels without the presence of the quoteboard itself. A "Left Align Labels" check box has been added to enable alignment of the labels to the left edge of the label column of the quoteboard. The color of the quoteboard text is also more aware of the background color of each row, and now draws white text when the background color reach a certain darkness instead of always printing black text.
- Profile Indicator Enhancements
Several enhancements were make to the Profile Indicator. Peak and Valley lines can now be customized with color, width, and style. User may now specify the width of time-based profiles in pixels. Peaks and Valleys are now based on Time instead of Volume for time-based profiles.
- Developing VPOC for Composite Profiles
Users may now plot the developing VPOC using the Profile Indicator's RTL token "PROF". A new result has been added to PROF titled "Developing VPOC". When this result is selected, the developing VPOC is computed. When plotted, the result is similar to the developing VPOC available to the TPO Indicator. However, with this new PROF option, the user can access the developing VPOC of any of the many durations available to the Profile Indicator including daily, weekly, monthly, or even multi-year composites. In addition, this implementation is much more efficient than using the TPO Indicator. Those that are currently using TPO Indicator to plot the developing VPOC should reconsider this new option.
- Pivot Point "Locked" Option Added
A check box has been added to the Pivot Point indicator titled "Locked". When the pivot point is locked, it cannot be adjusted with the keyboard. When a pivot point is unlocked, the left and right arrows on the keyboard adjust the "Bars Back" setting when the Pivot Point is selected. Most user would prefer the "Bars Back" setting remain locked at 0. This new option is similar to the "locked" check box of the Reference Line indicator which locks the reference line to a price and doesn't allow the price to be adjusted with the up/down arrows on the keyboard when selected.
- New Zig Zag Oscillator Result Options
Five Zig Zag Oscillator result options were added including: Bars Since X Pivots Back, Volume Since X Pivots Back, Delta Since X Pivots Back, Volume Per Price Since X Pivots Back, and Delta Per Price Since X Pivots Back. These results accumulate data (volume, delta, number of bars) from a user-specified number of pivots back to the present, and in some cases, divides that result by the price change since that pivot.
- Layered Periodicities
Three Line Break, Point and Figure, Heiken Ashi, Average Bars. A check box option was added to the Instrument window titled "Layer" which enables new periodicity options: Three Line Break, Point and Figure, Heiken Ashi, and Average Bars. These periodicities are unique in that they all build upon another underlying set of bars of any existing periodicity. For example, a 5-minute Point and Figure would operate on the closing prices of the 5-minute bars instead of inspecting every tick. A daily Three Line Break will process and consider only the closing prices of each daily bar. For these options, the underlying periodicity will be loaded and present invisibly in the chart. The Point and Figure bars should be drawn with a Point and Figure style. The Three Line Break charts can be draw either as candlesticks or as Wickless Candles to provide the classic presentation. The Point and Figure option that has been available for some time processes and considers every tick while this new layered option processes only the closing prices of the user-specified underlying periodicity. The Heiken Ashi and Average Bars use an averaging technique to average out the current bars with previous information. The Heiken Ashi uses a two-bar averaging technique while the Moving Bars allows the to specify the number of bars averaged. For example, if a user specified a 5-bar Average Bar of 1-minute data, the result would moving 5-minute bars, with each bar representing a moving window into the past 5-minutes. And two consecutive bars would actually share 4 minutes of information. Be on the lookout in our video library for videos providing more details on these new layered periodicities.
- Aligned With Master- Matching Parent
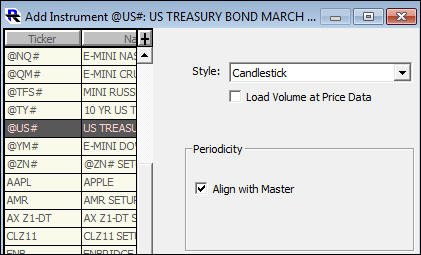
A checkbox titled "Align With Master" has been added to the Instrument window. This option will line up a secondary instrument with the timestamps of the master instrument. In the past, this has been impossible with any periodicity that was not time-based, e.g. Range Bars, Volume Bars, Tick bars, etc. Now, a user can plot a Range Bar of some master instrument and plot bars of one or more secondary instruments below that line up with (match) the time period spanned by the bars of the master instrument. Within each bar of the secondary instrument will reside the trades that transpired during the same period as the master instrument. When the periodicity of the master instrument is adjusted, the secondary instrument will continue to align with the data of the master. This has many potential uses including the ability to plot a statistic or index such as TICK or TRIN in a secondary pane below a master futures instrument, aligned with the data of the master. The "Align With Master" option will only be available in the Instrument dialog when adding a second instrument to a chart. To add an instrument to a chart, use the top left button on the chart toolbar.
- Export Trading Notes
Within the trading notes window you can export all of the trading notes for a symbol by selecting that symbol and choosing File: Save: Save As Export. If the Trading Notes window is the front window and you hold down the Ctrl key on the keyboard while choosing File: Save As Text, Investor/RT will export all trading notes for all symbols. You may also export all trading notes using File: Export: Trading Notes with no need to open the trading notes window. The resulting export file is shown after export is complete. This feature may be useful for example if you use Investor/RT on more than one machine and you wish to export all notes from one machine and import them using Investor/RT on the other machine. Use File: Import: Definition File to import the trading notes.
- Floating Window Positioning Improvement
For users with multiple monitors on MS Windows, Investor/RT is designed to work best when the main Investor/RT task window is maximized on one of the monitors and screen real estate on other monitors is used to float Investor/RT charts, quotepages and other windows. Investor/RT works best when the main Investor/RT task window is kept at a fixed position and size. The reason for this is that all floating windows reside at positions (on other monitors usually) relative to the position of the upper left corner of the task window. Moving, resizing, repositioning the screen location of the main Investor/RT task window can cause ill side-effects when floating windows are opened since floating windows will now be positioned at the same relative offset from the new task window location. In extreme cases, this can lead to a floating window being positioned at a location "off screen" making it invisible to the user. The Window/Bring to Front menu item (with Ctrl key down) was the only way to bring such windows back to the main screen in Version 10.4.x and earlier. Version 10.5 solves this problem by determining when opening floating windows, whether the saved offset from the task window would cause the window to be moved off screen. If so, the window is automatically repositioned to a default location centered on the main task window to ensure it remains visible. You can then drag the window(s) to other monitors and position them as desired; there is no longer a need to use the Bring to Front menu to retrieve off screen windows. Note that this anomaly situation occurs if you reposition the upper left corner of the main task window. In some cases, adjusting the multiple monitor setup by adding or removing monitors can also manifest these off screen side effects. Regardless, floating windows will now remain visible when such adjustments are made.
- Multi-Link Chart Scrolling and Time Synchronization
Investor/RT has long had the ability to Multi-Link two or more charts so that a change of symbol in one chart is propagated to one or more linked charts. The linkage of charts is accomplished by specifying the same Multi-Link color for some group of charts. The Multi-Link color for a chart is shown in the lower right corner of the chart. Clicking on this colored rectangle displays a menu for selecting a Multi-Link color for the chart. By convention, charts set to black are locked; they do not participate in any Multi-Link operations. Charts set to white Multi-Link color participate is all Multi-Link operations. When there is a Multi-Link change of symbol in a chart designated red, for example, the same symbol will be propagated to all other red charts plus any white coded charts.
Version 10.5 introduces the capability to scroll and time sync charts in tandem using the Multi-Linking method, i.e. scrolling a red chart to a certain date time can cause Multi-Linked charts to scroll to the same date time. See the support article for full details on this capability in Investor/RT.
- Developing VPOC Option for Profile Indicator
A check box has been added to the Profile Indicator titled "Developing VPOC". When enabled, the developing VPOC is plotted allowing the user to see how the VPOC changed from bar to bar as the profile formed. This option is available to all of the many flexible durations of the Profile Indicator including 30-minute profiles, daily profiles, or long-term composite profiles. The TPO Indicator has always made available the developing VPOC of daily profiles but this addition to the Profile Indicator is much more efficient and opens up this functionality to a much wider array of profile durations.
- Current Price Label Updating During Closed Session
Multi-Pane charts provide an option to "Highlight Price In Scale" in the Options tab of each chart's preferences. This option draws the current price as highlighted text in the scale at the right. Prior to 10.5, the price updated only when the session of the chart was open. In version 10.5, the price will update even if the session of the chart is closed. This allows users to see price updating in a day session chart prior to session open, or after the session closes.
- Opening Most Recent Chart, Quotepage, RTL
IRT maintains lists of the most recently referenced charts, quote pages, and RTL. You can review these lists of recent items, implemented as IRT Groups, by clicking the Open Groups icon on the main toolbar, or by using the menu File: Open: Groups (shortcut ALT-4). Select the Recent group of interest and a list of charts, quote pages or RTL items will appear for selection with the most recently referenced item at the top of the list. In version 10.5 there is now a shortcut for opening the most recent chart, quote page, or RTL item. Shift-click on the main toolbar Open Chart button to open the most recent chart; if that chart window is already open, it will be brought to the front. Similarly shift-click the Open Quotepage button or the Open RTL button to open the most recent item of that kind. If you import an RTL object, IRT now adds the RTL object(s) imported to the .Recent RTL group, thus right after import, you can SHIFT-Click the RTL icon on the main toolbar to view the most recently imported RTL.
- Quickly Change Chart Session Using Keyboard
Multi-pane charts respond to the keyboard in several ways. Type an alphabetic character or @ for example, and the chart assumes you want to change the symbol in the chart so a dialog appears to assist you. Keep typing the letters of the symbol you want and press the enter key to switch to that symbol. Similarly, typing a numeric digit 0-9 opens the periodicity selection window. For example, if you have a 5-minuute chart open, type 15 and press enter to change to 15-minute periodicity. If you have a 500 Volume Bar chart open, type 600 and press enter to change to 600 Volume Bar.
To quickly change the chart override session, type a comma (or grave accent `) character followed by the session number you want and press enter. The comma calls up the Change Session dialog. The subsequent digits specify the session number and the enter key applies the session change, dismissing the dialog. The dialog also has a session menu accessible by clicking the down arrow. The menu lists all sessions and their trading hours. Say you have a Session 31 chart that you sometimes wish to view using Session 2 override to see only day session trading. Press .+2+enter to quickly switch to session 2. Then press .+3+enter to change back. The grave character is positioned on the keyboard at the left of the row of number keys, so this character may be more convenient than a period, for example when you want to switch the session 2, strike `2` and the chart will change to session 2. The first grave opens the dialog, the digit 2 specifies the session, the second grave accept the entry (no need to hit the enter key. This can be done quickly with one hand in the upper left portion of the keyboard.
The Change Session dialog has some keyboard shortcuts. Either the Esc key or period key will dismiss the dialog without changing the chart. Thus you can type two comma in succession to quickly see the current session setup of a chart without changing it. The P shortcut opens session preferences, so .p takes you to Setup: Preferences: Sessions where you can review or add new session setups. The N shortcut takes the chart back to "No Override Session". Thus when the chart is overriden to Session 2, the two keystrokes ,n will set the chart back to Session 31. The four keystrokes comma+3+1+enter does the same.
The Change Session dialog also detects override session errors. If you specify a session number that does not exist, the dialog will issue an error message and continue prompting for a valid session number. If you enter a valid session number but the hours of that session are not a proper subset of the main instrument session, an error message will report this and the dialog will continue prompting for a valid override session number. If you choose a session number from the menu, IRT will check to verify that the session you have selected is a valid override session for the chart. If so, the OK button will be enabled to accept that session; if the OK button dims this indicates the selected session number has trading hours that overlap with the session start and stop times of the primary instrument in the chart. More details on incompatible sessions can be found by searching the Investor/RT helpdesk (enter the phrase incompatible session in the Ask Question box at the top of this article and click Search).
- Setting up Charts To Begin at a Future Time
IRT 10.5 now permits charts to be setup with a viewing period "Begin to Present" where the beginning date and time you specify is in the future. For example. before the day session begins, you can set the view period of a chart to begin at current date and say 9:30, well before 9:30 has arrived. The chart will initialially show no data, just a notation saying "Chart Begins 9:30 AM". At 9:30 the chart will being updating as trades occur, showing no data for periods before the starting time.
- Quickly Toggle Chart Whitespace On/Off Using Keyboard
Setup: Preferences: Keyboard Shortcuts can be used to create a function key shortcut for toggling chart whitespace. Choose Toolbar...Chart as the function key action, and choose "Toggle WhiteSpace..." as the toolbar item. If the front chart window is a fixed time interval chart eligible for whitespace toggle, pressing the function key repeatedly will show the chart with or without whitespace for non-trading periods. As an added convenience, when an eligible multi-paned chart is the front window, pressing either the comma or asterisk key on the keyboard is a built-in shortcut for toggling whitespace on/off.
- Mouse Scroll Wheel for Instrument (Symbol) Selection
Various instrument selection windows in Investor/RT have been enhanced to accept mouse scroll wheel scrolling though the instrument selection list. For example, if you right-click on an instrument in a chart, a window opens with an instrument selection list for replacing the current symbol being charted with a new one. Similarly, clicking the Add Instrument button on the chart toolbar opens a window for selecting the symbol to add to the chart. Both of these now support mouse wheel scrolling. The Setup: Preferences: Configuration window was also enhaced to support mouse wheel scrolling though the list of configuration variables. In the Setup Instrument window, clicking the Add Instrument button at the top, opens an instrument selection window that now supports mouse wheel scrolling. Instrument selectors in general should now inherit this enhancement but there may be a few execptions. If you come across an exception where the mouse wheel is non-functional please report it.
- Profile Drawing Styles - Streamers
Four new drawing styles have been added to the Profile Indicator including: Filled Line, Hollow Line, Shaded Line, and Streamers. Each of these options connect a line between the volume at each price. The Filled Line option fills these lines with a solid color. The Hollow Lines draws the a hollow line basing the line thickness on the thickness supplied in the color control at the upper right corner of the Profile preferences. The shaded works just like the Filled Line option except it shades each price based on relative volume at price and using the shading color provided. Streamers works similar to the Hollow Line option but with a variable width line based on the volume at price with larger volume at price receiving a bolder line. These four options are available in the "Draw As" drop down listbox in the Profile Preferences.
- Smoothed Profile Indicator
A smoothing option has been added to the Profile Indicator allowing the user to perform a vertical smoothing of the profile. A check box titled "Smoothed" turns this option on and the user supplies the smoothing period. A 9 period smoothing would result in each price displaying an averaged volume at price, averaging the volume of the price with the volume of the 4 prices above and below it (9 prices total). Vertical smoothing results in a smoother profile with more clearly defined high and low volume areas.
- Zig Zag Up/Down Slope Coloring
A Up/Down Slope coloring option has been added to the Zig Zag indicator. A listbox has been added to the right of the trendline color which gives existing options of "One Color" and "Trend Coloring" along with the new option of "Up/Down Slope". When Trend Coloring or Up/Down Slope are selected, the color control provides both the user a way to specify two colors. The Trend Coloring option now also allows the user the ability to specify the two colors instead of forcing red and green as it did in the past.
- Fractal Higher High, Lower Low Coloring
A coloring option has been added to the Fractals indicator titled "Higher High, Lower Low". When this option is checked, the Fractal markers along with their text will be colored based on Higher Highs or Higher Lows (up color) or Lower Highs or Lower Lows (down color). In addition, a "With Text Labels" checkbox is provided to allow the user to label the markers automatically with HH (higher high), LH (lower high), LL (lower low) and HL (higher low).
- Position Indicator - New Results
Two results have been added to the Position Indicator: Session From End of Data and Sessions From Start of Data. These results tell the user how many sessions back into the chart or data each bar resides. If the result of "Sessions From End of Data" were selected, each bar in the most recent session would have a value of 1 while each bar in the previous session would have a value of 2, and so forth. This option can be especially valuable in custom indicators when the user wishes to see the values of an indicator only for the current session: MA * (POS = 1).
- Camarilla Pivots
The Camarilla Pivots have been added to the Pivot Point Indicator. Camarilla is turned on by selected the "Camarilla" option from the Pivot Point drop down list. These pivots average the previous days high, low, and close as the pivot point. The support and resistance levels are computed by subtracting and adding multiples (1.1/12, 1.1/6, 1.1/4) of the previous high/low range to the previous close.
- Session Statistics - Chart Statistics
An option has been added to the Session Statistics indicator allowing users to compute statistics involving all the bars in the "Chart". This new "Chart" option is in addition to the options of Session, Week, Month, and Year. With this new option, users can easily draw lines showing historically the highest high of all bars of the chart or lowest low of all bars of the chart.
- Info Box Labels for Indicators
The Info Box Indicator can now print descriptive labels for each indicator displayed in the Info Box. The Info Box has an option to display any panes indicator values. In past versions, the labels for these indicator values used generic labels based on the name of the indicator used. Users now add custom indicators and session statistics indicators multiple times to a single pane, generally to plot time-sensitive prices such as the highest high of the week or the IB high. Users are now able to customize these labels regardless of what indicator produces them. Each indicator has an option to supply a custom text label at the bottom of the indicators preference window. When this custom text labels is turned on, it will be used by the Info Box. These custom text labels will also be appended to other lists of chart elements to help assist the user in identifying specific indicators from a long list. The Info Box now also uses the display format of the indicator if one is supplied at the bottom of the indicator's preferences.
- Gann Arcs
A Draw Gann Arcs option has been added to the Gann Angles Indicator. When this option is turned on, a circular arc is drawn from the end of the x1 line using the x1 lines length as the radius. Addition options for the Arc include "Project Angles from Arc" and "Custom Projection Length". When "Project Angles from Arc" is checked, the x2, x3, etc, angles will be projected only from the drawn arc. When the "Custom Projection Length" checkbox is checked, these projections will be drawn with a fixed length instead of drawing all the way to end of chart. The length of this project can be provided with user options of "x * Radius", "x * Radius * asin(Angle)", "x * Radius + asin(Angle)", or "(Radius/cos(Angle))-Radius" where the user supplies the x value.
- Stochastic RSI
A "Stochastic RSI" check box has been added to the Stochastic Indicator. When this option is checked, all stochastic calculations (RawK, FastD, SlowD) will be performed on the RSI results instead of the bar prices. The user can supply the RSI period along with whether or not to use Exponential Gain/Loss Smoothing. When the Exponential option is not checked, the RSI will be calculated with a simple smoothing method (this is the equivalent of the Morris Modified option of the RSI Indicator). Users have been able to create the Stochastic RSI in prior versions using custom indicators (SLOWD(RSI), FASTD(RSI), etc) but this makes it much more convenient and efficient to add the multiple Stochastic levels with a single indicator. Stochastic RSI is available now to users of Standard editions of IRT.
- Reference Lines Repeating Alerts
Reference Lines have an alert capability where a touch or break of the reference line triggers a specified signal action. Signal actions can play sounds or produce a message alert, or even execute a trading order. Once a reference line alert is triggered it can be reset manually, either via the preferences or by dragging the line to a new price level to re-enable the alert.
Version 10.5 introduces an automatic reset feature for reference line signal actions. When reset is enabled, the signal action alert is reset at the beginning of each bar. In effect the alert is active for each new bar; if it should trigger, it remains in that triggered state until the end of the bar; then the indicator will automatically reset and resume testing for reference line penetration when the next bar begins. The reset option is especially helpful when using reference line alerts in indicator panes, e.g. a pane containing the Volume Analysis Indicator. You may place a reference line in the volume pane at a significant volume level. An alert will be triggered each time any bar's volume reaches that level. Reference line alerts can be used in this way for all indicators. Automatic reset can also be applied to price alerts for instruments that break a certain reference line price level.
In the Reference Line preferences you specify whether you want to be alerted when the reference line is penetrated from either direction (touching or breaking through the line from above, from below, or from either direction). This is especially useful for oscillating indicators such as RSI, MACD, or Stochastics, where there are typically multiple levels of interest. In this scenario you add two reference lines with reset "on", one to alert when some high level is reached from below, the other to alert when some low level is penetrated from above.
- Briefly Hiding Indicators Within Instrument Panes
In a busy multi-pane chart it may sometimes be useful to view the chart momentarily without all of the indicators that are normally present in the same pane as the instrument(s). With a multi-pane chart as the front window, pressing the minus key draws instruments alone in their panes. By default the chart automatically returns to normal after 5 seconds. If you occasionally want an extended period to see the chart with only the instrument(s) in view, press shift + minus (the underscore character). The chart will display no indicators for 60 seconds. Pressing the minus key again while indicators are hidden returns the chart to normal immediately.
In summary, use the minus key to momentarily view the chart without indicators with automatic resumption of normal drawing in 5 seconds. Use shift + minus for an extended view of instruments alone in their panes. Pressing minus while indicators are hidden returns to normal charting. The momentary period default of 5 seconds is user adjustable by setting a configuration variable in Setup: Preferences: Configuration. Set HideIndicatorSeconds=10, for example, if you want the momentary period to be 10 seconds instead of 5.
- Quickly Change Chart View Period Using the Keyboard
When a multi-pane chart is the front window, the keyboard period key serves as a shortcut for viewing/revising the "View Period" of the chart. If the chart's present view period is "Last N Days" or "Begin Date to Present", a small window will appear to accept further input. For example a "Last 3 days" chart can be quickly revised to show the last 5 days by typing three keystrokes: period+5+enter. Similarly period+10+enter updates the chart to show the most recent 10 days of trading. When the chart in question is set to show some begin date "To Present", the same small window appears with a date entry control highlighted so you can use tab or shift-tab to move from Month to Day to Year and revise the date. The tab key also tabs out of the date control entirely so you can set the chart to "Last N Days" instead. If the window shows "Last N Days", pressing tab selects "Begin to Present". Futher keyboard input can then be used to adjust the begin date. Notice that when entering a date, the number of days back for that date is shown in the Last N Days entry box. Similarly when you adjust the N for Last N Days, the date N days ago is reflected in the date control.
The date control in the Change View window is initially shown in Month Day Year form. You can use the down arrow menu at the left end of the date control to put the date entry control into "Relative Date" mode. In this mode, dates can be specifies as N units ago, e.g. N days, weeks, months, etc. The tab key is used to move through the entry boxes as you would expect. When you tab to the Month in fixed date format, up/down arrow keys cycle through the months or you can type the first character of a month. In relative mode after tabbing to the unit entry box, up/down arrow keys cycle through the units choices or type d for days, w for weeks, m for months, y for years, etc.
When you type the period into a chart that is set to one of the other view period options (Begin to Ending Date, or N Days Ending, the View preference tab of the chart preferences will appear showing the current view period. You may then use the tab key in similar fashion to tab through the entry boxes and set new dates or change the N of N Days Ending. A mouse click can be used to change to a different view period option.
- Profile Indicator: Custom Gradient/Blend
Two more new drawing options were added to the Profile Indicator to provide the user more flexibility with respect to the display of volume- or time- based profiles. These two new options are available for the Volume Profile drawing style and are titled "Custom Gradient" and "Custom Blend". Both these options allow the user to select their own two colors, one for the high volume and one for low volume. The Custom Gradient fades a horizontal gradient from the high volume color to the low volume color. Each price presents a gradient from the low volume color towards the high volume color, with the higher volume prices digging deeper into the high volume color and resulting in a very pleasing aesthetic presentation. The Custom Blend draws each price in a single color which is a blend of the high and low volume colors, but that color is computed based on the volume of that price with higher volume prices blending towards the higher volume color and lower volume prices blending towards the lower volume color. These options offer the user complete flexibilty with respect to volume profile color options.
- TurboRTL and Experimental Configuration Variables
Investor/RT 10.5 has two new experimental features that were developed during the final phase of candidate release testing. Both are significant improvements that we expect to integrate into IRT in the near future. They are available to users for experimentation until these features can be more thoroughly tested. Both features are off by default and may be turned on/off as desired using Setup: Preferences: Configuration.
Set TurboRTL to true to experiment with a faster RTL calculation engine. RTL formulas that use statistical functions (MIN, MAX, AVG, etc) will calculate much faster in custom indicators and signal markers. When TurboRTL is enabled, custom indicator calculations in general are faster, more noticeably so when the indicator is calculating initially on thousands of bars, e.g. when opening a long term intra-day chart having such indicator(s). Charts open much faster, charts recalculate much faster after a backfill, backtests and optimizations run faster, etc. If you have a particularly demanding custom indicator you may see it listed in the message log should it take more than 1000 milliseconds to calculate, e.g. when opening a chart and doing a full calculation. In extreme cases, for example a chart of five years of 5 minute bars (96,000 bars) a statistical RTL formula that took minutes to calculate now calculates in under 2 seconds. Please provide feedback on the effects you observe with TurboRTL set true. By making this experimental feature available we want feedback not only on how calculation times improve but also to verify that all RTL formulas are producing the identical results as when TurboRTL is false.
Set Experimental to true to enable testing of tick data sequence verification methods that monitor and correct date/time sequencing errors during chart loading. We have had isolated reports of charts showing a gap that can be remedied by performing a Full Data Download. When Experimental is set true, IRT will monitor tick date/time sequencing as part of all data loading operations. IRT does this very efficiently, making note of any needed data sequence corrections. The goal is to provide constant monitoring for data integrity as a normal by product of retrieving data for charts and other purposes, and to apply corrective actions automatically to improve data integrity and thereby improve the reliability of IRT charts. When a sequencing issue is detected a notice is placed in the message log. In the absence of any log messages when opening chart(s) it can be inferred that all tick data has been verified for proper date/time sequence.
- Miscellaneous 10.5 Fixes and Improvements
- When opening the Setup Instruments from a floating window, e.g. a chart, the Setup: Instruments window will now become a floating window so it appears above the requesting window. Note that checking the box titled "Floating Window" inside the Advanced section of the Setup: Instruments window will cause all Setup: Instrument to be opened as floating windows if desired.
- At startup Investor/RT deletes temporary files from the Admin folder. Backtesting reports are considered temporary files but these are now deleted only after they are 30 days old. A configuration variable can be used to keep backtesting reports for a longer time. Go to Setup: Preferences: Configuration and override the variable BacktestReportsDays to the number of retention days desired, e.g. set BacktestReportsDays=365 to keep the reports files around for year for future reference.
- You may now provide color/style/width of peak/valley lines in the setup for the Profile Indicator. This indicator is available only in the TPO Profile editions of Investor/RT.
- A new result, "Delta Above/Below Close/Last Price", is available in the VPS (Volume Price Statistics) indicator. When added to a chart of full session periodicity (e.g. 405 minute, or 1425 minutes), this new result shows cumulative delta for each trading session.
- Transact/Infinity clients can do File: Open: Admin File and select the file named TransactContracts.txt to see a list of all futures and index symbols available to them. The format of this file has been improved to show the future type and the actual ticker symbol to enter into Investor/RT to track each contract or index, e.g.
6A: 6AZ1
6B: 6BZ1
6C: 6CZ1
6E: 6EZ1
6J: 6JZ1
6M: 6MZ1
6N: 6NZ1
6S: 6SZ1
EMD: EMDZ1
ES: ESZ1
NQ: NQZ1 - Exported definitions of scans, trading signals and custom indicators will now include only the export of token setups for tokens that are actually referenced within the RTL formula syntax. If export of unreferenced tokens is desired, go to Setup: Preferences: Configuration and set:
RTLExportUnreferencedTokens=true
Note that you may eliminate unreferenced (unused) tokens from any RTL setup by right-clicking on a column heading in the token list on the right and choosing Remove Unused Tokens. - Investor/RT has an extensive list of setup information for various types of futures contracts. See Setup: Preferences: Future Types to view/edit/add future types. When you add a new instrument (symbol) to Investor/RT with security type future, it is important that the software know the characteristics of that type of future, e.g. its trading hours, the display format (tick increment), the name of the future type, etc. When you use the Setup: Instruments window to add a new futures symbol, e.g. ESZ11, Investor/RT determines ES is the type and fills in various information automatically. If you enter a symbol for a type of future that is presently unknown to Investor/RT, the new future type is now setup automatically. When this occurs the first time for some new future type, the new future type setup will appear in a window to enable you to verify, revise and ok the new setup. The new future type name will include the words SETUP NEEDED. Replace this with the actual name of the future type. Investor/RT will setup the tick increment based on the display format you entered for the new futures contract symbol. We recommend that you determine and fill in the dollar value of this price move. Click OK to save any changes. You can edit the future type at a later time via Setup: Preferences: Future Types.
- When a reference line, setup to "Use Current Close" is placed in a pane that contains another indicator (and no instrument), the reference line will consider the current value of the indicator as the close. This enables reference lines to show the present indicator value across the full indicator pane for comparison with historical values of the indicator.
- The Object Editor has been improved to allow you to inspect the details of a chart (which instruments and indicators it contains) without actually opening the chart. This feature is designed as a diagnostic tool for inspecting a problematic chart in cases where opening the chart may cause an out-of-memory condition or some other fatal error exception. To inspect the setup details for a chart, call up the Object Editor from the Open menu; select Charts as the object type; select a chart name in the list; and click the View button while holding down both the SHIFT and CTRL keys. A report window will appear showing information about the selected chart: how many panes it has, what instruments and indicators reside in each pane, etc. Note that exporting the definition of a chart involves opening the chart internally. If exporting the chart definition is not possible, this chart inspector may be useful in diagnosing the problem.
Sometimes exporting a chart definition was not possible in 10.4 and earlier because the export process opens the chart with historical data invisibly in order to export the setup information. This process has been improved in 10.5 so that charts are opened without loading any historical data into them. This enables many chart setups to be exported for diagnostic purposes that otherwise might have caused an out-of-memory error for example due to an incorrect or corrupted setup. - Weekly VWAP option was added to the VWAP Indicator.
- "Extend Naked Highs/Lows" Option was added to the Fractals Indicator.
- The Send Email window (File: New: Email Message...Alt-M) has a button titled Insert Msg Log; clicking it will insert the text of the message log into the message body. This may be useful when sending the log to support to report a problem.
- Quotepages containing custom columns and only a single symbol were not calculating the custom columns while the quotepage is minimized. This has been corrected.
- The Import Current Data schedule action (See Setup: Schedules) has been extended to support scheduled imports of files containing definitional text. A use of this automation could be a regularly scheduled import of a defintion file containing trading notes listing the trades taken using some other trading platform.
- By default Investor/RT has long ignored trading holiday dates when charting overnight session instruments (typically futures contracts) because typically there is at least some trading perhaps in the early a.m. or late in the day of most trading holidays. Charting time interval periodicities without white space is often used around holidays so that all non-trading periods are simply not shown in the chart. You can elect to show the non-trading periods as white space or not by right-click in the chart and toggling Periodicity → Whitespace on/off. This setting for overnight session instruments is a configuration variable (see Setup: Preferences: Configuration) with default value: NoHolidaysOvernightSessions=true;
Version 10.5 offers a similar configuration variable: NoHolidaysDaySessions=false. This one defaults to false, meaning that any holiday date specified in the holidays (or myholidays) file is effectively removed from charts. This setting works well for day session instruments, e.g. equities assigned to the U.S. Stocks session 0, on holidays. International users may wish for example to set NoHolidaysDaySessions=true when charting day session instruments that continue trading on international markets on trading holiday dates that pertain only to the U.S. markets. Setting NoHolidaysDaySessions=true means that holiday dates will be present in intra-day charts whether there is data or not. Turning off whitespace will eliminate the non-trading periods from charts for instruments that are not trading, while allowing those instruments that are trading to properly show the market data for those days. Using this setting may be more convenient than assigning U.S. equities to one session and non-U.S. equities to another.
In short, if you use the configuration settings...
NoHolidaysOvernightSessions=true;
NoHolidaysDaySessions=true;
...Investor/RT will ignore any holiday dates that may be specified in the holidays.txt file or the user override myholidays.txt file, for all sessions, all instruments. When charting intra-day time intervals with white space on, non-trading periods will appear as a gap of white space. To eliminate the whitespace and show all trading data continuously, turn off the whitespace in the periodicity setup. Note that time independent periodicities, e.g. range bars, change bars, volume bars etc. are inherently "no whitespace" periodicities. Fixed time interval periodicities can be rendered in the chart with our without whitespace indicating non-trading periods. - Right-click menu in multi-pane charts was revised to add an Export → Definition to Clipboard menu item. Either the Save or Export submenus can be used now to export the definition text for the chart either to a file or to the clipboard for pasting.
- Setup → Preferences → Configuration now has a much needed built-in help feature that shows some help text for the currently selected configuration variable.