Many users would like to add the Profile Indicator to longer time frame charts like Daily, Weekly or Monthly periodicity charts. When a Profile Indicator is added to such a chart, the profiles fail to display accurately because daily, weekly, monthly bar data does not have the necessary level of detail.
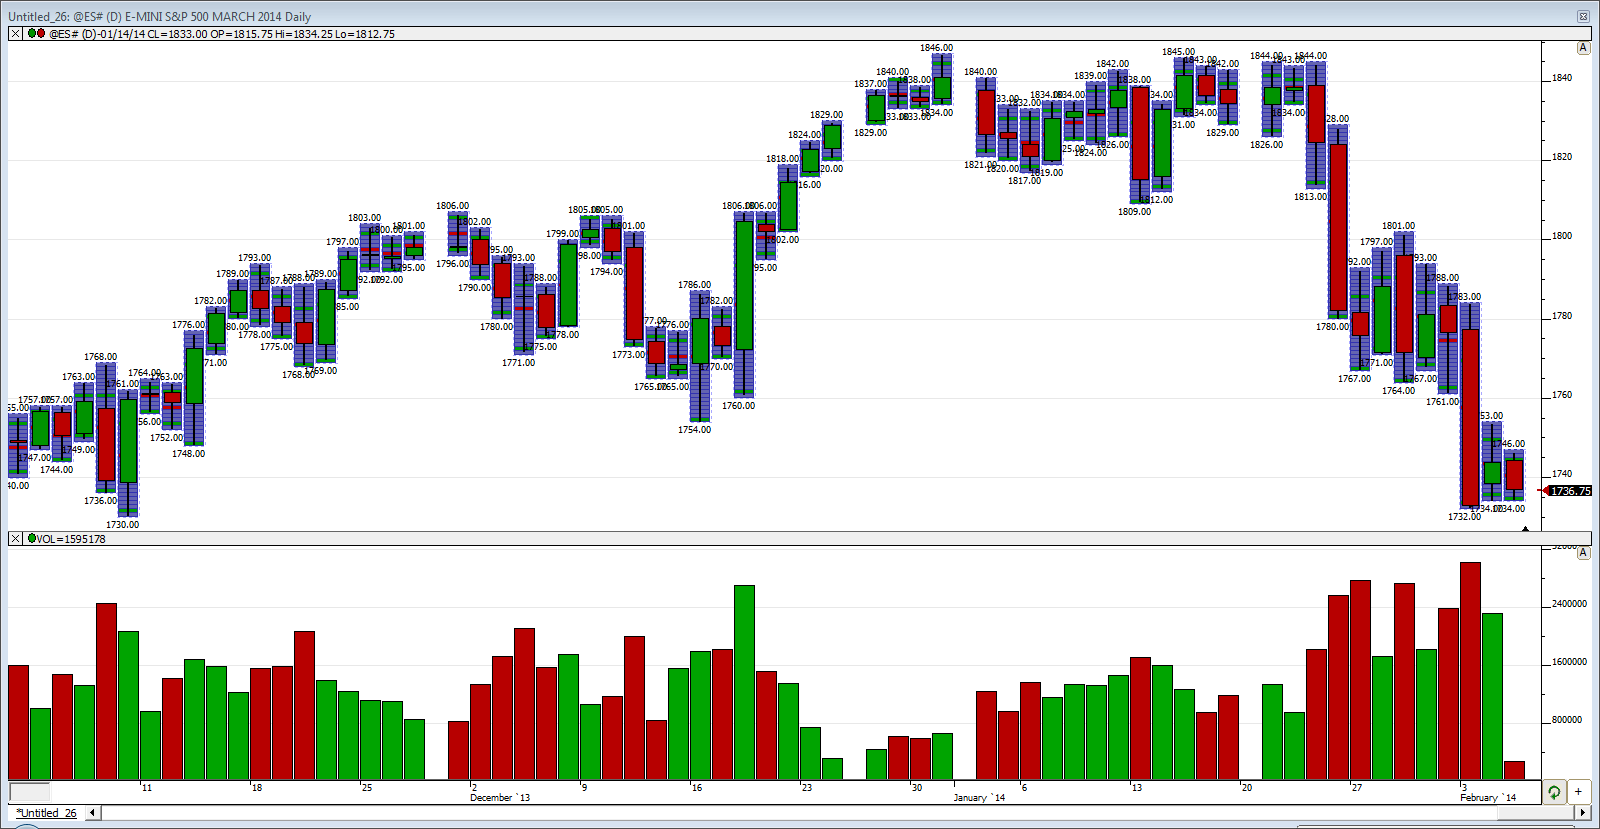
Let's use the example of a Daily chart to explain. When you create a Daily chart, Investor/RT requests daily bars from your data source. Each daily bar has five values: open, high, low, close and the total volume for the day. The daily bars have no details about how much volume occurred at each price. So if the range on the S&P ES Futures contract on a particular day was between 1550.00 and 1565.00, the daily bar does not include any data about how much volume was traded at each price level in that trading range. Unfortunately, you end up with a chart that looks like this:
In order to profile daily trading volume at each price, Investor/RT must derive the charting data from intraday data. This requires the use of a different periodicity. Right click the chart and open the Chart Preferences window. Select the Period Tab and click inside the Periodicity control to open the Periodicity window as shown here:
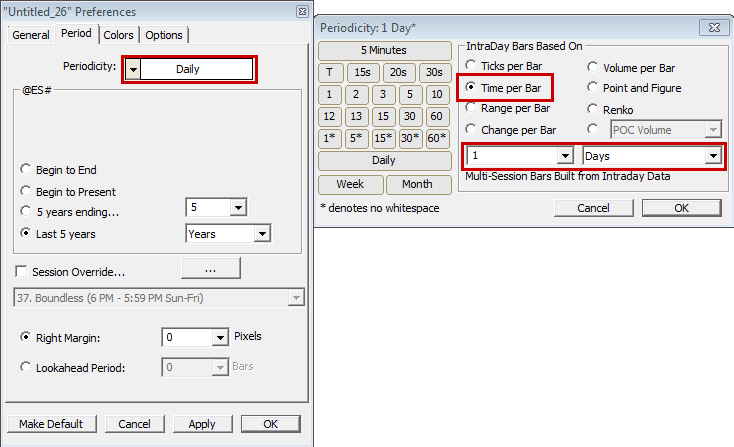
Choose Time per Bar and select 1 Days from the available menus as shown above. Notice the text Multi-Session Bars Built from Intraday Data. With this periodicity, the bars for each trading day are built from intraday data from which Investor/RT determines the volume traded at each price within each 1 day bar. Your longer term charts will then show volume at price as shown below. You must, of course, have sufficient intra-day data on file to produce such charts. If your charts show detailed profiles for a limited number of days, you may revise your data retention settings for the instrument(s) in question at Setup > Preferences > Historical Data. Increase the number of intra-day days there, then right-click inside the chart and choose Download > Full Data.
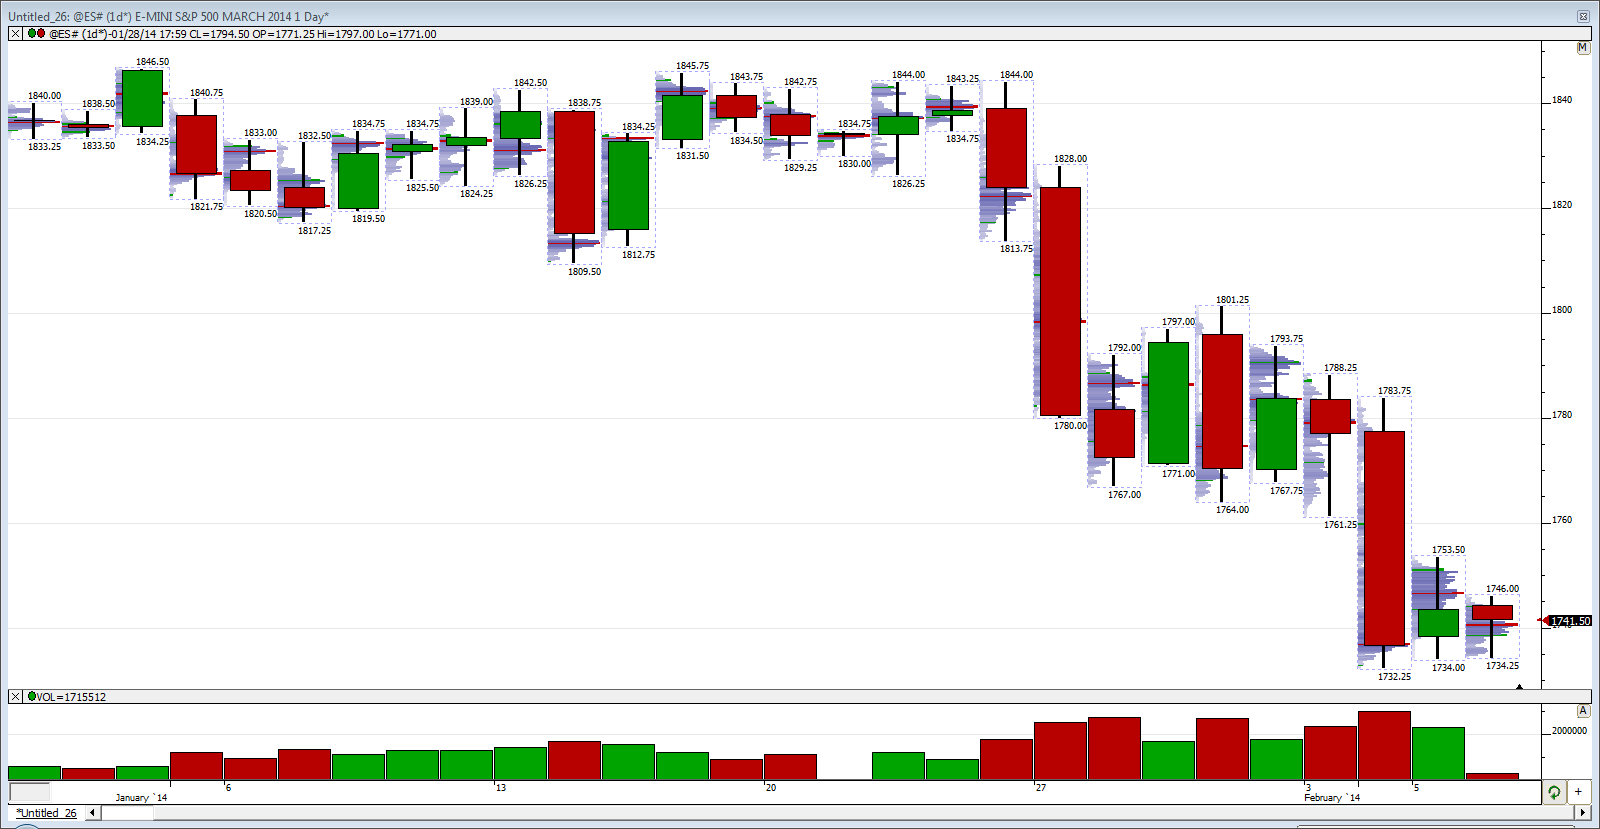
The example above illustrates how to profile daily trading volume, one profile per day. By adjusting the periodicity of the chart you can profile any number of days, weeks or months per bar (per profile). Using Time per Bar periodicity, specify the units (days, weeks, months) and the number of units.