There are actually multiple ways to do multiple periodicities. Let's use the specific example above of overlaying a 5-minute stochastics on a 1-minute chart. Let's further assume that we are specifically after the "Fast %D" component of that 5-minute stochastics.
Using Mixed Periodicity Data Indicator (MPD)
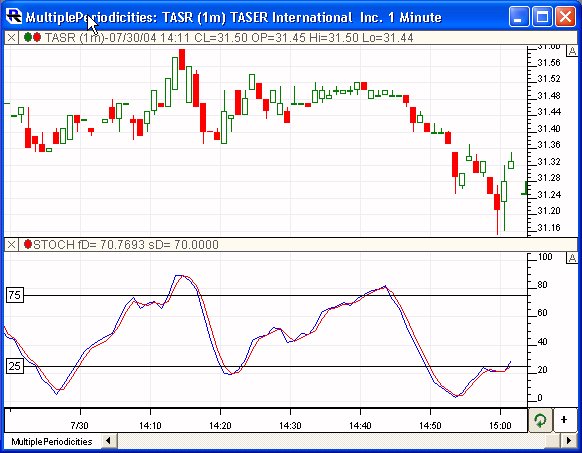
Once solution (and probably the most popular solution now days) would be to use the Mixed Periodicity (MPD) indicator. We'll start with a simple 1-minute chart of TASR with the stochastics indicator added in a second pane as seen below.
Now, click the "Add Indicator" button in the chart toolbar (top right button) or hit the Insert key on your keyboard to bring up the "Add Indicator" window. Select the MPD indicator from the list on the left, and specify the settings similar to what you see below.
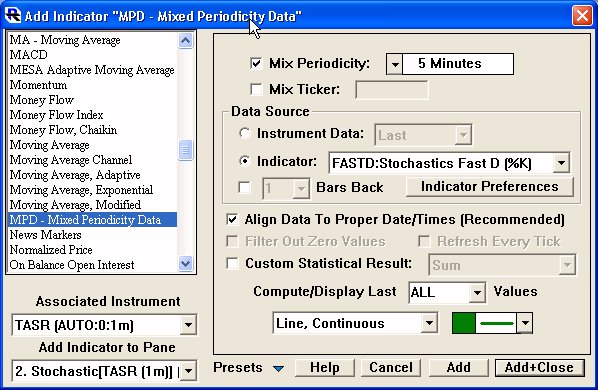
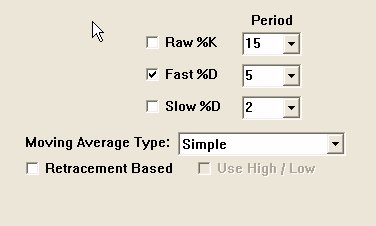
Note especially that the "Mix Periodicity" is checked and set to 5-minutes, and the "Data Source" is set to "Indicator: FASTD". Click on the "Indicator Preferences" button and specify your preferred settings in the stochastics preference button that appears.
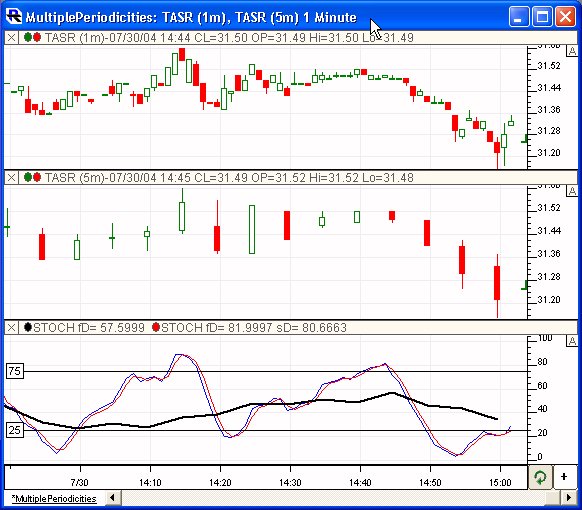
The resulting MPD indicator will look something like the green stepped line seen overlaying the 1-minute stochastics indicator in the lower pane of the chart below. Since the indicator is built using 5-minute data, the value will remain constant over 5 1-minute bars...thus the stepped effect.
Using Mixed Periodicity Chart (Multiple Instruments)
The other solution would be use Mixed Periodicity charting: adding multiple instruments to the same chart (using same symbol) with different periodicities.
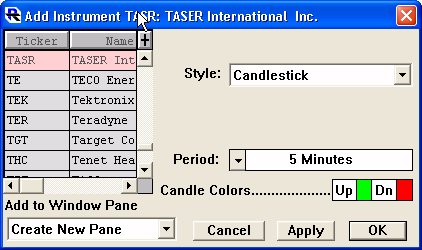
First, click the Add Instrument button on the chart toolbar (top left button) or use the Shift-Insert keyboard combination, to bring up the Add Instrument window. The window should already be setup with the same symbol and periodicity as the chart. Change the periodicity to 5-minute and your window should look something like this:
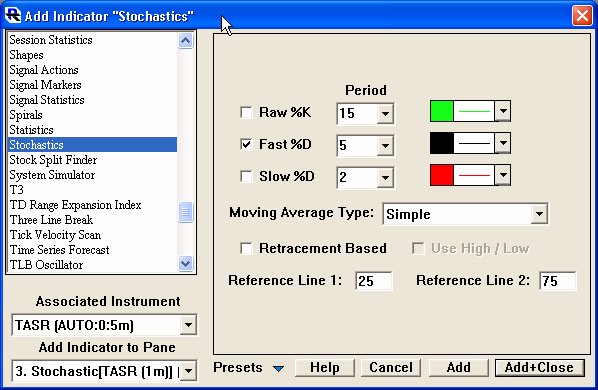
Now click the OK button and the 5-minute candles will be added in a separate pane in the chart. As you would expect you will only see 5 1-minute bars for every 1 5-minute bar (see chart at the bottom). Now that you have both the 1- and 5-minute instruments added to the chart, you can attach any indicator that you add to the chart to either instrument. In our example, we will choose to "associate" the Stochastics indicator to the 5-minute instrument, and add it to the same pane as the existing 1-minute Stochastics indicator. Notice the "Associated Instrument" and the Add Indicator to Pane settings in the window below.
The resulting chart will look similar to the one below. Notice the black 5-minute stochastics Fast %D line in the bottom pane overlaying the 1-minute stochastics. If you would rather not see the 5-minute candles at all, you may drag them into the upper pane with the 1-minute candles, then double-click on candles to bring up the preferences on them, and change the Style to Invisible.