Also see: Diplaying Time/Ticks/Range Left In Bar Forum Topic
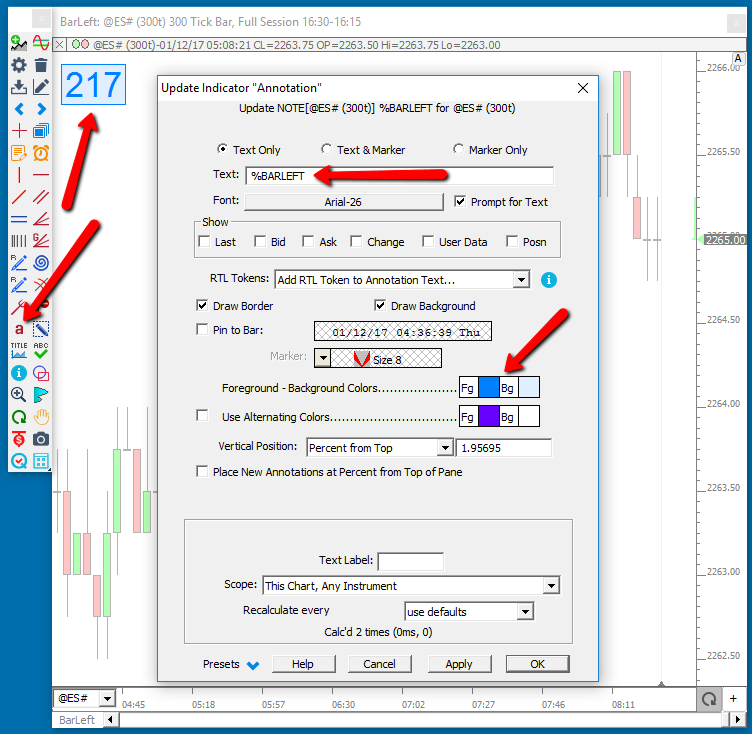
First, add an Annotation to a chart. To do so, click on the "a" button in the chart toolbar (or right-click in the chart and choose "Draw: Annotation") and then click in the chart where you want the annotation. A text box will appear. Type in the text: %BARLEFT and press Enter This will give you the following
- Time left in the bar, in time-based periodicities (1-min, 30-min, etc)
- Number of ticks left in tick-bar periodicities.
- Amount of volume needed to complete the current bar in volume-bar periodicities.
- Price change needed to complete the current rangebar, changebar, Renko or PNF bar
You can update the text of the Annotation by double-clicking in the Annotation box to bring up its preferences.
The Volume Breakdown indicator also has result options which allow you to plot the time, ticks, or volume in each bar historically. The chart below shows 5000 volume-bars. Notice the annotation (using %BARLEFT) is showing that 4787 contracts are needed to complete the current bar. The second pane shows the Volume Breakdown indicator displaying a result of "Time In Bar (Secs)", and thus showing how many seconds were spent in each bar. In the bottom pane, Volume Breakdown is showing a result of "trades/ticks", providing the number of trades it took to reach the 5000 volume threshold in each bar. Volume Breakdown is available in the Pro version of Investor/RT.
The annotation in the upper pane shows the number of ticks left in the current 100 tickbar. The Info Box in the bottom pane, along with the custom indicator histogram described above, shows the time expired in the current bar (as of the last tick). NOTE: These values update at each tick, so if 10 seconds elapsed between ticks, the info box in the bottom pane would not update with each second during that period.