Manipulating Bar and Candle Width This video demonstrates the process.
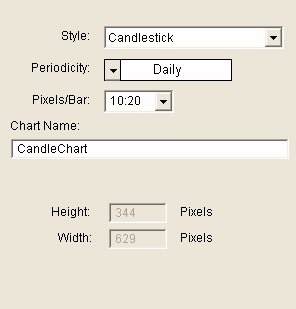
Yes. Open your preference window for the chart (double-clicking in horizontal scale at bottom of chart will get you there). In the "General" tab, you’ll find the “Pixels/Bar” setting, which controls the number of pixels allocated to each bar. Instead of a single number, you can manually enter text in the following format:
X:Y
The Y will actually control how thick (horizontally wide) in pixels, the bar/candle is drawn, while X will control the space allocated for each bar. Y can be larger or smaller than X. If Y is larger larger than X, then the bars/candles will overlap. If Y is smaller than X, there will be more space between each bar/candle. If you want your bars drawn big, and your current chart is setup with a pixels/bar of 10, you might try...
10:20
...for starters, and go from there, as seen in the preference window below:
By default, the Y value (bar width) is not allowed to exceed the X value (bar space). However, if a user does wish to draw the bars wider than the space provide, he may turn on a configuration varialbe (a one time operation) that will allow for this. Go to "Setup: Configuration" and set the variable ChrtAllowCandleOverlap to True, then click Apply.
Once you’ve setup your pixels/bar in this manner (both an X and Y number), you can manually adjust the thickness of the bars (Y) by holding down the Ctrl+Shiift keys while operating the mouse scroll wheel (Shift-Up Arrow and Shift-Down Arrow” keys will also work). You can control the space allocated to each bar (zoom in and out) by operating the mouse scroll wheel without the Shift+Ctrl (or Up and Down Arrow keys). Once you've setup your chart with a specific bar/candle width in this way, it will stick even when zooming in and out. In order to revert your chart back to standard behavior, just setup Pixels/Bar with a single number again.
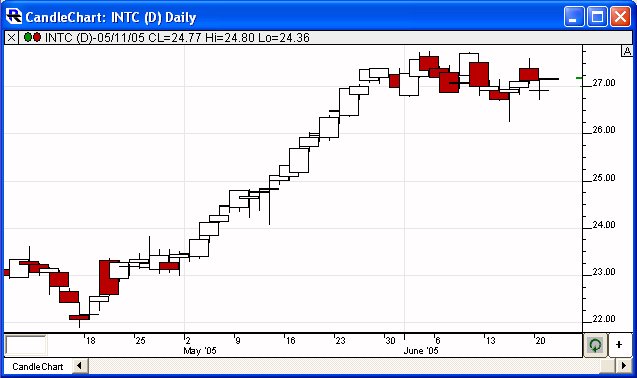
This chart shows an example of 10:20 candles...
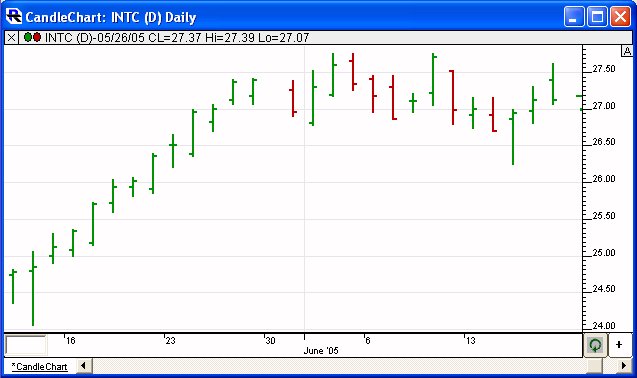
While this chart shows an example of 20:10 bars...
As an analogy, think of Y as the width of your house, and X as width of your yard. Your house is always centered within width of yard. If you enter a single number for pixels per bar, the width of house and yard will adjust together as you operate the scrollwheel. If you enter two numbers, then the scrollwheel alone adjusts the width of your yard while leaving width of house constant, and Ctrl-Shift-scrollwheel adjusts the width of your house while leaving yard width constant.
If you really like this behavior, and want all charts to go into this mode every time you operate the Shift+Ctrl+Scrollwheel, simply set the Configuration variable CtrlShiftPPBControl to True. Then, anytime you click on a chart and operate Shift+Ctrl+Scrollwheel, the chart will go into a mode where the scrollwheel will adjust the space allocated for each bar (the yard) and Ctrl+Shift+Scrollwheel will adjust the width of the bar (the house).