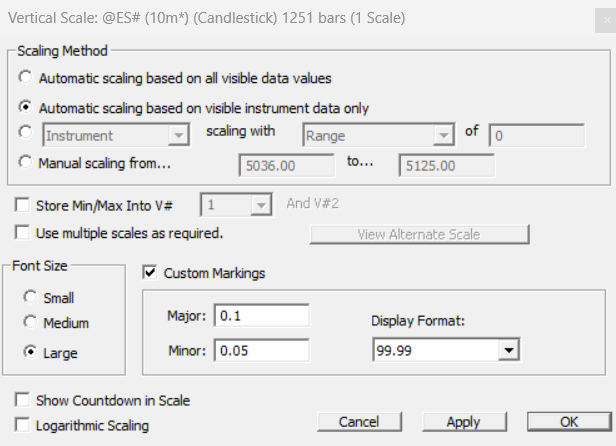
Vertical Scale Preferences
Traditional Charts
- Vertical Scale Preferences
- Scaling Methods
- Switching Quickly Between Scaling Methods
- Adjusting scale by dragging/clicking
- Multiple Scaling
- Ordering Chart Elements in a Pane
- Custom Markings
- Font Sizes
- Logarithmic Scaling
- Panning
Please note that all these scaling preferences may be accessed through buttons as detailed here : https://www.linnsoft.com/support/using-chart-buttons-adjust-scaling
-
+Vertical Scale Preferences
Traditional charts can have one or multiple window panes. Each window pane can contain one or multiple elements. Each element may be either an instrument or a technical indicator. Each window pane has its own set of preferences that control the behavior of the vertical scale of that pane. The vertical scale preference window for each window pane can be accessed by either right-clicking, or double-clicking anywhere in that scales vertical pane. -
Scaling Methods
The Scaling Method groupbox in the vertical scale preferences dictates the method that will be used to determine the range of the vertical scale of that pane. The range represents the span between the maximum and minimum values that will be displayed in the vertical scale. A detailed description of each method follows...-
Automatic based on all data values
This is the most common, and therefore the default method. All new chart window panes will inherit this method by default. This method considers all the values in the window pane, and computes the range based on the highest high and lowest low actual values. The scale is automatically adjusted to reflect the data that is visible in the chart pane. If multiple elements exist in the pane, it considers the values of all elements when determining the maximum and minimum scaled values (assuming all elements are sharing the same scale : see Multiple Scaling for more information). The scale range can change as new bars come in (and fall off), or as the chart is scrolled left or right, or as the chart is resized horizontally (causing the number of visible bars to change). -
Automatic based on instrument only
This method is similar to the first method (Automated based on all data values), except it only considers the instrument values when computing the scale range. This option can be useful when a long term (200-period) moving average also exist in the window pane, having extreme values that might be well outside the extreme values of the instrument. This method forces the scale range to consider only the instrument values. In this case, the instrument will then use the full range of the scale, while the long term moving average may go off the top and/or bottom of the scale. -
Manual Scaling from X to Y
This method allows the user to manually specify the maximum (Y) and minimum (X) values in the scaling range. The range will stay constant, regardless of new bars coming in, scrolling, or vertical resizing. The scale range will not be automatically adjusted to reflect the actual data values in the pane. -
Range-Based Scaling
[Automatic/Manual] scaling based on fixed [Range, Pixels/Unit, % of Price, % of Pane, Slope] of Z
The primary motivation behind range-based scaling is to provide a method to keep the vertical height of price, vertical relationships between prices, and even price/time relationships, constant. Range-Based scaling gives the user 5 different options of controlling the range of the vertical scale. Each of the 5 options can be set to automatic of manual. The automatic option will center the specified range on the actual range of values in the chart pane. The manual option gives the user the ability to drag the range up or down as needed provide the picture desired. If the automatic option is selected, dragging the pane up or down will reset the scale to manual mode and allow the user to position his range accordingly. It is recommended to begin with automated, and then position the range manually by dragging.Some of the following range-based values are hard for the user to compute. By simply entering a value of 0, or leaving the value blank, Investor/RT will automatically compute the best-fit value that will cause the computed range to equal the actual range. This computed value can then be adjusted manually by dragging if desired, or by re-opening the preference window and adjusting directly.
The 5 options provided in range-based scaling follow...
-
Range
This option allows the user to specify a fixed range of values for the vertical scale. The spread between the maximum and minimum scaled values will remain constant. For instance, if the user specified an automated range of 4, and the actual range was 5 to 7, then the visible range shown by the vertical scale would be 4 to 8. If the user pans or scrolls the pane vertically, the minimum and maximum values will change, but the range (difference between them) will remain constant. -
Pixels/Unit
This option essentially gives the user control over the vertical resolution of the window pane. It is the vertical equivalent of the horizontal pixels per bar preference available in the chart preferences. It dictates the number of pixels that will be used to represent each one price unit (dollar, pound, etc.). If a value of 100 is specified on a chart of MSFT for instance, the each 100 pixels vertical segment represents a $1 range. -
% of Price
This option allows the user to specify the range as a percentage of the actual price. The maximum value in the actual range will be used for the price. For instance, if a value of 5 % is specified, and the maximum actual value in the chart pane is $100, then the price range would be $5 (5% of $100). This option may be helpful when frequently switching symbols. -
% of Pane
This option allows the user to specify the range as a percentage of the actual range. For instance, a value of 80%, on a pane with an actual range of $10 (max $100, min $90) would result in a range of $8 (showing $91 to $99 in automatic mode). Similarly, a value of 120%would result in a range of $12 ($89 to $101 in automatic mode). This option can be helpful if the user likes to see more or less room on either side of the actual data in the chart. -
Slope (Price/Bar)
This option may be the most difficult to completely comprehend, but may be the most useful when trying to maintain constant price/time relationships regardless of scrolling, panning, or resizing. This option allows the user to specify a fixed relationship between price vertically and time horizontally. It basically passes control of the range over to the horizontal pixels per bar setting. The setting controls how much price the width of each bar represents. In other words, if a value of 0.5 is specified, and the horizontal pixels per bar is 10 pixels, then the vertical scale will be drawn with 10 pixels for every 50 cents, or a pixels/unit of 20. The vertical range is then computed based on 20 pixels/unit. While the explanation may be somewhat confusing, the important thing to understand is this option gives you the ability to maintain a constant picture with respect to price/time relationships. In other words, trendlines will maintain their slopes regardless of the vertical size of the chart, the actual date values in the pane, or the scrolled position of the chart. And trendlines will continue to pass through the same prices of every bar regardless.
-
-
-
Switching Quickly Between Scaling Methods
The current scaling method can be seen at any time in each panes scale in the upper right corner. The following characters represent the following states:
A Automatic based on all data values
O Automatic based on Instrument Only
M Manual Scaling
RA Automatic Range-Based
RM Manual Range-Based
* - Multiple Scaling (will precede any of the other options)
If the chart is in manual mode, clicking on the M will change the M to an A and bring the scaling back into automatic mode and force the scale to be recalculated. If the chart is in manual range-based mode RM, then clicking on the RM will change the RM to an RA and bring the scaling back into automatic range-based mode, forcing the scale to be recalculated accordingly. If the chart is in A, O, or RA mode, clicking on letter(s) will simply continuously cycle between these three in that order. In other words, click on A, it turns to O. Click on O, it turns into RA. And finally, click on RA and it becomes A. -
Adjusting scale by dragging/clicking
Vertical scaling by default is Automatic. The scale minimum and maximum price values are obtained automatically by examining the price values of the instrument(s) in each chart pane as well as associated indicators. Manually scaling can set by right-clicking (control-click on Macintosh) in the vertical scale area to access the Vertical Scale Setup window. A faster way to adjust the scale values and turn on manual scaling is to mouse down and drag the mouse up or down in the vertical scale area of the chart pane. Where the mouse down (left mouse button) occurs affects the action when you drag the mouse. If you mouse down in the left hand side of the vertical scale area, the "Hand" cursor appears. Dragging the hand adjusts either the minimum or maximum scale value. Mouse down in the upper half of the pane to adjust the maximum scale value, in the lower half of the pane to adjust the minimum scale value. Mouse down in the right hand side of the vertical scale area displays the "Vertical Resize" cursor. Dragging the resize cursor adjusts both minimum and maximum values, increasing both values in tandem as you drag upward, decreasing both value in tandem was you drag downward. Note that after dragging, the scale is set to manual mode-scale adjustments will be required to observe price action outside the newly set minimum and maximum scale values. -
Multiple Scaling
If the window pane contains multiple elements, then the pane is a candidate for multiple scaling if desired. Multiple scaling is most efficient when trying to overlay elements that do not scale to the same range of values. An example might be trying to overlay the volume indicator on top of an instrument. While the instrument may have a range of $10 from $90 to $100, the volume has a range of 100,000 from 15,000 to 115,000. Trying to chart these two elements in the same pane without multiple scaling would result in a range of 10 to 115,000 and cause the instrument to be drawn with tiny unreadable bars at the extreme bottom of the pane. With multiple scaling, each element will essentially be considered on an individual case, with an individual scale. This allows each element to use and share the full vertical space of the pane. The actual number in the scale can only represent one element at any time. To adjust which element is reflected in the scale,Ctrl-click in the vertical scale, or open the vertical scale preferences and click the View Alternate Scale or Shift-click in the vertical scale to view a window that provides complete flexibility over element ordering. If multiple-scaling is on, an asterisks * will be visible in the upper right corner of the vertical scale, to the left of the letter(s) representing the scaling method. -
Ordering Chart Elements in a Pane
Traditional chart window pane titles show the values of the instrument(s) and indicator(s) for each bar as you move the mouse within the chart window. The pane title is often insufficiently wide to show every instrument and indicator value. The order of the chart elements within the pane governs the order in which the values are displayed (as well as which element controls the scale if multiple scaling is turned on). The only mechanism heretofore to adjust the element order within the pane was a shift-click in the vertical scale area to cycle the elements in the pane, moving the first element shown in the pane title to the end. In Version 5.5, a more flexible method of ordering pane titles was added. The Order Chart Pane Elements window can be accessed in three ways:
1. Using the chart window popup menu, choose Add/Delete/Edit: Element Order.
2. Shift-click in the vertical scale area of the pane.
3. Right-click on the title bar of the pane you wish to order.
A window appears listing the elements within the pane in the order that values are displayed in the pane title. To move an element, select it and click the Top, Bottom, Up, or Down buttons. Double-clicking on an element both selects it and moves it to the top of the list. Shift-clicking does the same. Ctrl-clicking an element (option-click on Macintosh) selects the elements and moves it to the bottom of the list. A Cycle button is also provided. It does what shift-click in the scale area used to do, that is, it moves the top element to the bottom, make the second item the new top element. Ctrl-clicking in the scale area now performs this cycling action (without opening the Order Elements window). The ordering window is displayed just below the pane title bar so you can click Apply at anytime to see how the revised pane title bar will look without having to move the window out of the way. -
Custom Markings
The markings (major and minor hash marks) that are show on the chart are by default determined automatically. The "Custom Markings" option allows the user to have control over the prices at which these marks are drawn, and the spacing of these marks. The Major Markings are drawn with a longer hash mark, labeled with price, and associated with a horizontal gridline drawn through the chart pane (if gridlines are turned on in the chart preferences). The Minor Markings are drawn between the Major Markings with smaller hash marks and no associated labels or gridlines. The user may specify a Major Marking of 1 with a Minor Marking of 0.25. If the range of scaled values went from 4.3 to 6.1, Major Markings would be drawn at 5 and 6, while minor markings would be drawn at 4.5, 4.75, 5.25, 5.5, and 5.75. -
Font Sizes
The vertical scale settings window also has a "Small/Medium/Large" choice box for the font size to be used when drawing the price values on the vertical axis. Each pane in the chart can have its own setting. The font size used in the top most pane of the chart is also used when drawing the time scale horizontal axis. When the pixels per bar setting is very small (below 3) Investor/RT forces small font size in the horizontal scale drawing. -
Logarithmic Scaling
Each chart pane can be scaled normally (arithmetically) or logarithmically (base 10). Normal scaling will be turned on by default. A checkbox in the lower corner of the vertical scale preferences labeled Logarithmic Scaling converts the scale to logarithmic. Logarithmic scales are popular for their ability to show similar price moves by the same vertical distance. For instance, a move from $5 to $10 on a logarithmic scale would represent the same vertical distance as a move from $50 to $100. Both moves would represent a gain of 100% and therefore this equal representation vertical can be very informative. Log scaling should not be used when negative values are involved in the chart window pane. Negative numbers are have no logarithmic equivalent and the result is undefined. -
Panning
When instrument-only scaling is in effect, it is common for reference lines, trendlines, and other technical indicators like long term moving averages to be "off screen" since the vertical scale only spans the range of prices realized by the instrument itself. Version 5.2 introduced a new tool on the charting toolbar, the pan tool. The pan tool allows you to easily move the graphic elements in the chart up or down, left or right, using the mouse, in order to bring off-screen indicators fully into view.
The pane tool can be activated using a button on the toolbar, will be activated automatically if the user mouses down in the chart for a user-specified amount of time. The key is to mouse down in a "white space" area of the chart so your mouse down will not be misinterpreted as a click to select a particular graphic element in the chart. When you mouse down in white space and keep the mouse down, you will notice that the arrow cursor changes to the hand cursor. Keep the mouse button down as you glide the mouse to pan the chart window. There is a preference in Setup: Prefs: Charts: General labeled Delay chart panning on mouse down for __ seconds. This setting controls how long you must hold the mouse down before the panning feature will be activated. Once it is activated, you may drag the chart pane in any direction. If the pane was dragged vertically, it will then be left in manual scaling mode. A good delay setting might be 40 seconds. This setting exists to prevent accidental panning on mouse downs that are intended for other actions (and therefore, prevent unintended changing of the scaling into manual mode).
The pan tool can also be activated by clicking on the "hand" icon in the chart toolbar. The mouse cursor turns into a hand. Place the mouse pointer anywhere inside a chart pane, mouse down and hold the mouse down while moving the pane in any direction. Vertical movements cause the price scale to move as you glide the mouse up or down. Similarly, horizontal movements shift the time axis as you glide the mouse left or right. The panning tool remains active as long as the "hand" icon is depressed in the toolbar.
Panning the chart in this way is very useful for temporarily bringing a reference line or trendline, or some other indicator that lies outside the normal price scale into view. Notice that after completing a pan operation, the vertical scale is always in "Manual Scale" mode, that is, the price scale has been set to particular values based on your mouse movements. We have added a visual indicator to the upper right corner of every chart pane to quickly inform you of the scaling status. The visual indicator is simply the letter M for manual scaling, A for full auto scaling, and O for Only Instrument scaling. After a pan operation, the indicator letter will always read M for manual scaling. To return to auto scaling, simply click the mouse on the indicator letter. Each click will alternate between Auto (A) scaling and (O) Only Instrument Scaling. This new feature eliminates the need to use the Vertical Scale preferences panel to turn on auto or instrument-only scaling. The scaling indicator also tells you at a glance whether more than once scale is available in the pane. For example, if you had an RSI and an a candlestick chart inside the same pane, Investor/RT would use two scales. When more than one scale is in effect the letter indicator has a plus sign after the letter, e.g. A+ means auto-scaling, multiple scales in effect.
The only difference between using the pan tool in this way vs. activating the pan tool using the toolbar, is that when the pan tool is active on the toolbar you can mouse down anywhere at all in the chart to pan the image. When the pan tool is not explicitly active on the toolbar, then a mouse down inside the pane causes I/RT to first determine if the mouse down is on a particular indicator or instrument graph and if so that element becomes selected and available for dragging where appropriate. If I/RT cannot select any element in the pane based on your mouse down, panning becomes active automatically as you keep the mouse down and drag.
Hold down the shift key while panning a chart. When you release the mouse, the chart will automatically snap back to auto-scaling. This technique is useful when you wish to temporarily pan the chart to inspect the values of trendlines or reference lines that may be off screen. Since auto-scaling is reinstated when you release the mouse there is no need to click in the upper right corner of the chart pane to return to auto-scaling. The "shift pan" is also useful when you want to make a horizontal adjustment in the "look ahead" period of the chart without affecting the vertical scaling of the chart. Other internal improvements were made so that chart window clicking will not result in manual scaling mode when panning is not intended. When you mouse down in a chart window in some white space area of a pane, the cursor will change to the hand cursor immediately, but the pan will not begin until you have moved the mouse pointer a small but definitive distance from the mouse down point. If you find a chart pane is in manual scaling mode as indicated by the M displayed in the upper right corner of the pane, you can quickly auto-scale the chart by shift panning a small distance. This may be more convenient than clicking on the M in some cases.