There are several methods for doing this. Please note that these methods are nowadays very rarely needed for the futures live streams we are getting from IQ feed, Rithmic, CQG or Interactive Brokers. For stock data reception, depending on the exchange, this might still have some interests. In all cases, a single bad tick may still happen on every market and the manual method discussed below always offers an efficient way to eliminate such outliers.
Of course, the first step is always first to verify/repair the tick database. Go to the data > database wizard menu and, in the "database repair and maintenance" section (at the bottom of the window), select Verify/Repair Historical Data
1) Automatic methods
1.1) Activating Tick filtering in the "Preferences > General" menu
If you turn on this tick filtering option, Investor/RT weeds out bad ticks before they reach the charts. A filtering preferences checkbox can be found towards the bottom of "Preferences > General" window, with the format: Ignore ticks with move >= X and percent move >= Y % The values for X and Y need not be integral. X = .5 and Y = 3.3 would cause Investor/RT to filter out incoming ticks which differ from the preceding tick in price by more than 50 cents where the distance in price from the prior tick exceeds 3.3 percent. RTL token BADTK can be used to reference the number of bad ticks filtered out for any instrument. For example, run the scan formula "BADTK > 0" to see a list of tickers with one or more bad ticks and the bad tick count for each one.
Note: each instrument setup window includes a "No tick data filtering" checkbox that allow the user to exclude some symbol from this automatic filtering process (whenever this feature is activated)
1.2) Scrub data feature
Right-click in the chart and choose "Scrub Data". Start with a light scrub and see if that solves the problem. If not, you can either try a Normal, Intermediate or Heavy scrub
2) Manual method
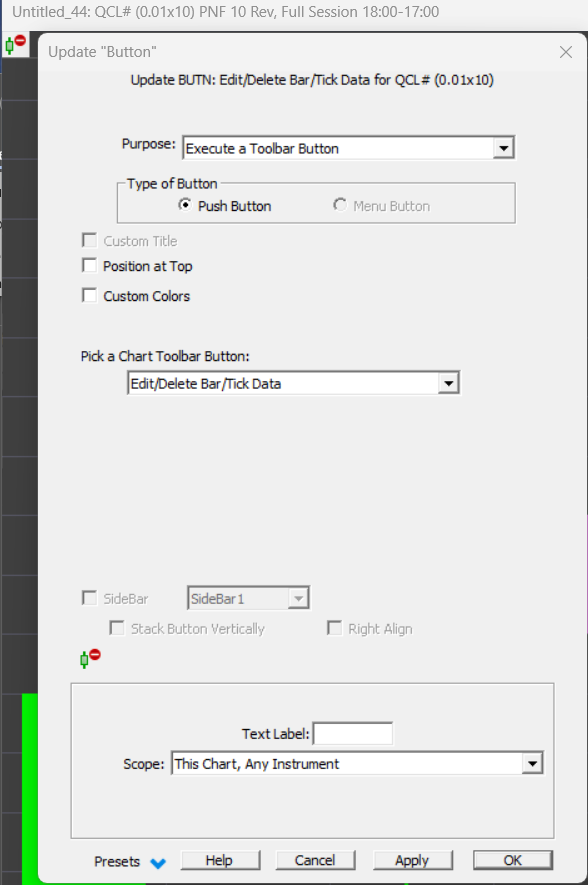
There is a button on the chart toolbar labeled "Edit/Delete Bar/Tick Data" (8th from bottom on right column). You may also create a chart button with the corresponding tool bar button task
When you get a bad tick in your chart, you should be able to quickly remove it using the following process. Click on this toolbar button, then click directly on the bar which contains the bad tick. The result should be a view/edit window containing the ticks that compose that bar. Click on the "Last" column heading once or twice to quickly sort the list of ticks by price, so that you can quickly find the extreme price that is causing the problem. Once found, place your cursor in the date/time field just to the left of this price, and then hit the delete key on your keyboard. A confirmation window will then appear. This should correct permanently your chart (ie that tick will be removed from the database).
If the bad tick didn't show up, maybe you clicked on wrong bar. You can also drag a rectangle around a group of bars to increase your chances of finding the bad tick (as opposed to just clicking on one bar). This process may seem involved, but it's really a 2 second operation once you get the hang of it. 4 quick mouse clicks and a strike on the delete key.
See Also