First, create a custom indicator called ProjHi with this syntax (LO + MAX(HI.1 - LO.1, 2)) * (POS = 1) where POS is setup as "bars from end of data"
Then create another custom indicator called ProjLo with this syntax (HI - MAX(HI.1 - LO.1, 2)) * (POS = 1)
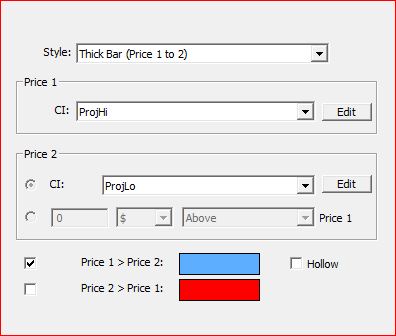
Now, add the Price Bands Indicator to your chart, setup as follows:
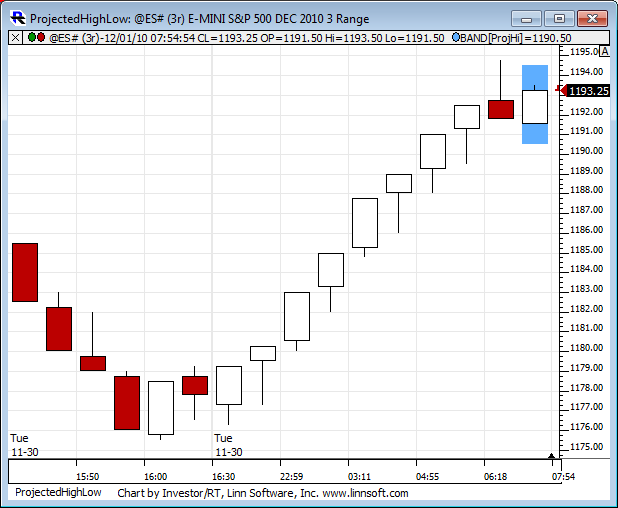
And you'll get the effect seen below. You can import this chart using this projectedhighlow Definition, then drag the band to any other rangebar chart by simply mousing-down on the top or bottom edge of the band, dragging it and dropping it into the other rangebar chart.