Using the Help Menu in Investor/RT
Investor/RT 14 offers an expanded Help menu to provide you with convenient access to Linn Software product support content, forums, the support ticketing system, and your Linn Software account information.
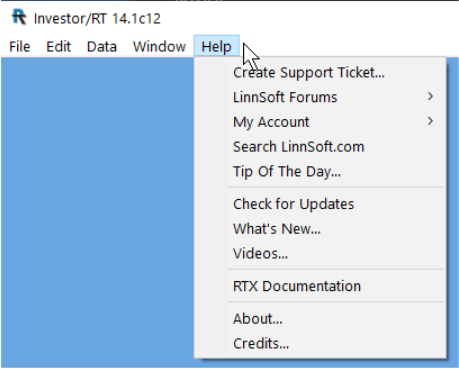
Investor/RT 14 offers an expanded Help menu to provide you with convenient access to Linn Software product support content, forums, the support ticketing system, and your Linn Software account information.
Investor/RT is not fully compatible with the larger font size settings of the Windows operating system. Investor/RT works best with the "Normal" or "Default" text size settings in the display options of the Windows control panel.When larger font sizes are used, certain Investor/RT windows do not display properly or optimally. To adjust, use your Windows search feature to search for Display Settings as shown in this image:
This 6 Minute video demonstrates how to setup lines and histogram-style indicators so they are drawn in different colors conditionally.
There are two indicators which will accomplish this: Session Statistics (SESST) and Mixed Periodicity Data (MPD). Session Statistics is a more reliable and efficient method and will be discussed first. One thing to keep in mind when trying to decide between the two methods is that MPD uses the daily bars while SESST uses the actual intraday data. Thus, MPD will always reflect the data present in the daily bars (which is generally the globex session data for futures) while SESST values will reflect the session to which the chart is assigned (can reflect either day session or globex session data for futures contracts).
Each running copy of TWS has a Socket Port number used to communicate with 3rd party applications. Normally TWS is setup to listen for API connections on socket port number 7496. Leave one TWS setup with socket port 7496. Go to the other TWS and use the Configure Menu; Configure-->API-->Socket Port and enter some other port number, e.g 7497. In Investor/RT, use the IB Menu; IB-->Setup and set the Port setting to the socket port number of the TWS to which you wish to connect.
The bid/ask feedback has been improved since this tutorial was originally written. Instead of dots at the bid and ask, we now draw a vertical line from the bid to the ask price. There is also a small horizontal line representing the current price that protrudes left from the bid/ask line (this becomes an arrow when in "Presentation Mode").
Unless you do very long term weekly/monthly charting, click “Yes” to accept the recommended settings.
Visit the Download Center for the most recent version of Investor/RT.
Setup > Preferences > Mail and Internet has a Check for Updates check box; when checked, Investor/RT will notify you at start up when a new release of the software is available and offer to download it. If you elect to turn off the automatic checking, you can check manually from time to time by choosing Check for Updates from the Investor/RT Help Menu.
This capability has been available in the portfolio for a long time. It was not implemented with an explicit user option in the portfolio preferences however, like it is in the quotepage preferences. When you right-click on any column in a portfolio and choose Optimize Column Widths you get the effect of Size to Show Full Column Title as you have discovered. If you want "Size to Show First Word of Title" then hold down the shift key while making the "Optimize..." menu selection.