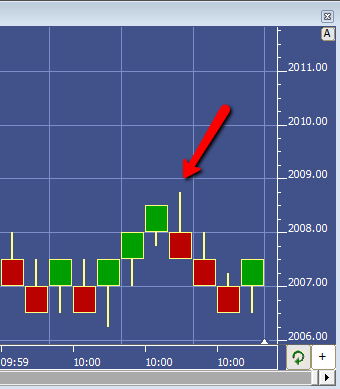
The tails of a Renko candlestick represent the high and low prices achieved in each bar, just like any other periodicity. Traditional Renko chartists are accumusted to plotting Renko bars without the tails. This can be achieved by changing the style of the bars to Wickless Candles (right-click in chart and choose "Style: Wickless Candles"). However, plotting Renko with a style of "Candlestick" and thus showing the wicks or tails can provide some important additional information regarding how high and how low price moved during the formation of that Renko bar.
Take a look at the image below. This is a 2 tick Renko chart of ES. And specifically focus on the bar pointed out by the red arrow. Many users are confused why the high (upper tail) of this bars is so high. But if you look closely, you'll see that the high price never moved high enough to produce another green bar. Price would have had to move 2 ticks above the high and close of the previous Renko bar. However, it only moved up one tick before reversing and travelling down far enough to complete the down Renko bar. So these wicks are certainly option, but can also be informative.