Overview
Investor/RT has long had the ability to Multi-Link two or more charts so that a change of symbol in one chart is propagated to one or more linked charts. The linkage of charts is accomplished by specifying the same Multi-Link color for some group of charts. The Multi-Link color for a chart is shown in the lower right corner of the chart. Clicking on this colored rectangle displays a menu for selecting a Multi-Link color for the chart. By convention, charts set to white are locked; they do not participate in any Multi-Link operations. When there is a Multi-Link change of symbol in a chart designated red, for example, the same symbol will be propagated to all other red charts.
Synchronized Scrolling
Today Investor/RT has the capability to scroll and time-sync charts in tandem using the same Multi-Linking method, i.e. scrolling a red chart to a certain date time can cause Multi-Linked charts to scroll to the same date time. This feature is available for multi-paned charts. The Multi-Linked charts can contain the same or different symbols and the charts can be of any mix of periodicities. Scrolling performed using a subject chart will cause the related Multi-Linked charts to scroll so that the time of the last displayed bar at the right side of each chart matches as closely as possible.
How to Enable Synchronized Scrolling
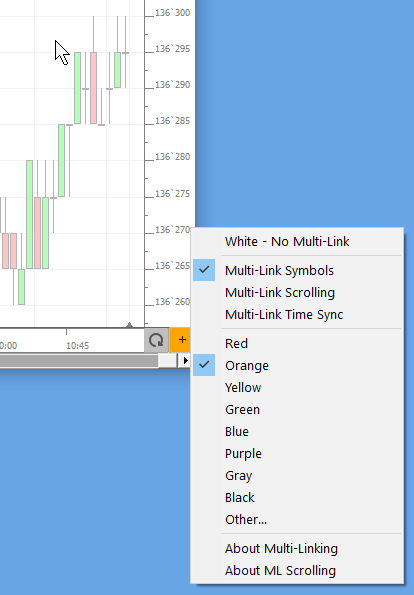
To enable these features, setup a group of charts with the same Multi-Link color, e.g. red. When you click the Multi-Link color button at the lower right corner of a chart, you will see menu items named Multi-Link Scrolling and Multi-Link Time Sync. These Multi-Link menu items will display a check mark when enabled for the chart. Choose either menu item to toggle the check mark on/off. The Multi-Link color rectangle itself will show the letter S when Multi-Link Scrolling is enabled for the chart or the letter T when Multi-Link Time Sync is enabled. Thus you can see at a glance which charts have the same Multi-Link color and which of them are enabled for Multi-Link scrolling or time syncing. Then perform scrolling operations on any enabled chart; observe how the related enabled charts scroll to the same date time ending period. Using the Chart Highlighter, point the mouse at the last bar of the subject chart and observe the corresponding bar(s) in the related charts. To turn on the Chart Highlighter, right-click in the main toolbar and check mark the Chart Highlighter menu item. Say you have a 15-minute, 5-minute and 1-minute chart setup for Multi-Link scrolling. Scroll the 15-minute chart to a specific ending time and then use the Chart Highlighter to highlight the last (rightmost) 15-minute bar; the corresponding three 5-minute bars and fifteen 1-min bars will highlight at the right side of the related charts.
Contrast Time Sync with Scrolling
Multi-Link Time Sync works in the same fashion as the Multi-Link Scrolling feature described in the paragraph above, but synchronizes not only the ending date/time of the chart but the visible time range of the data. The user may scroll, zoom, or resize one time-synced chart and any Multi-Linked chart with time-sync turned on will update to show the data for the same visible start and ending dates. This functionality can be useful for synchronizing several charts of differing periodicities with the same symbol, or several charts of matching periodicities containing different symbols.
The key difference between Multi-Link Scrolling and Multi-Link Time Sync is that Multi-Link Scrolling does not alter the spacing of the bars in any of the linked charts; as scrolling occurs it positions the visible data of each chart so that the last bar at the right side of each chart is approximately the same time. In contrast, Multi-Link Time Sync alters bar spacing as needed to fit the periodic data so that both the visible starting and ending bars span roughly the same period of time. Multi-Link Time Sync also ensures that as you use the mouse wheel or arrow keys to adjust the bar spacing in any linked chart, that the new time range of that chart is reflected in the linked chart. The same goes for resizing of chart windows that are setup for Time Sync. Note that for any chart either one or the other (or neither) of these Multi-Link synchronization modes can be in effect at a time. When you turn on Multi-Link Scrolling, Time Sync is turned off; when you turn on Time Sync, Multi-Link Scrolling is turned off.
Quickly Enabling Multi-Link Scrolling or Time Sync for a Group of Charts
Using the Multi-Link color menu you can turn on/off the Scrolling and Time Sync options individually for each chart in the group. You could have six charts in a multi-link group, but only four of them with Multi-Link Scrolling on for example. Most often however, you will want to turn on/off these options for every chart in the group. This can be accomplished easily with a single menu selection: simply hold down the shift keywhile changing either of these options and the change will be made to all charts in the multi-link group. Choosing the menu item toggles that choice on/off; the depressed shift key tells Investor/RT to set all charts in the Multi-Link group to the same setting. When you use the shift key you will see all of the multi-link color buttons change their display at once, the letter T indicating that Time Sync is in effect, S indicating that Scrolling is in effect. When neither of these are in effect for a chart, the color button will display a plus sign as in former releases.
Automatic Restoration of Chart Settings after Using Time Sync
As mentioned earlier, Multi-Link Time Sync makes adjustments to the bar spacing as needed to fit the appropriate bars into each chart in the group. When you turn off the Multi-Link Time Sync option for a chart (or all charts using the shift key), Investor/RT will restore each chart's bar spacing to the state it was in when Multi-Link Time Sync was enabled for the chart. In addtion. the chart will be automatically scrolled to present so that real-time updating in the price scale will resume.
Synchronized Scrolling of Daily, Weekly, Monthly Charts
While these synchronized scrolling features will typically be most useful when applied to a mix of intraday charts, Multi-Link Scrolling of daily charts works as expected, positioning the related intraday charts to the same ending date as the daily chart. Similarly, you can Multi-Link scroll a group of daily, weekly, monthly charts so that scrolling any of them keeps the corresponding trading dates in view for all of them. Multi-Link Time Sync applies only to intraday charts (not daily, weekly, monthly built from Daily Bar data), but also work well (as does the Chart Highlighter) for N-Day, N-Week, charts built from intraday data (See item 4 in the What's New in 10.5 topic, "Multi-Session Intraday Periodicity" for details)