
Periodicity is defined as the character of being periodic; the tendency to recur at regular intervals. Applied to market data analysis and Investor/RT in particular, the periodicity of a chart relates to the manner by which the periodic intervals of market data are determined. All the trading within an interval is defined as a bar, each bar having an open price, high, low, close and volume of trading during the interval. This tutorial presents the extensive range of periodicities available in Investor/RT. Periodicities are grouped into three categories: time dependent, volume dependent, and price dependent.
Time Dependent Periodicities - Second Bars, Minute Bars, Daily, Weekly, and Monthly
Time based periodicities are those where each bar is composed of the trading activity that occurred during a specific inteval of time. The open represents the first trade that occurred during the time period; the close represents the last trade. In the time interval, the volume and price range of each bar can vary greatly, while the duration of the time period is the same per bar.
Volume Dependent Periodicities - Tick, Tick Bars, Volume Bars, Delta based.
Volume dependent periodicities are those where each bar is composed of the price activity that occurred during the trading of a specific amount of volume or number of trades (ticks). In these periodicities, the price range and time of each bar can vary greatly, while the volume is the same for each bar.
Delta Bars - Creates a bar until a user-specified delta per bar is achieved. Delta is considered an absolute value for this periodicity.
POC Volume - POC Volume bars continue to build until the point of control of the bar achieves the user specified volume (when the *highest volume* price within the bar achieves the specified volume)
Volume Breakout - The range of the bar is determined once the volume level specified is achieved. Then when price breaks out of this range a new bar is formed.
Delta Reversal - Like reversal charts which are based up on the point and figure methodology, delta reversal charts also use the same methodology. The difference is instead of using price to be the determinant of the reversal, delta is used.
Heavy Sided - This creates a new bar only when a specified volume amount is traded on the bid side or ask side of a Footprint.
Price Delta - Creates a new bar when the entered delta value is achieved for any price within the current bar.
Range and Reversal - This periodicity requires each bar to complete both range and reversal criteria before beginning a new bar. The periodicity is specified as Range x Reverse, with the first integer dictating the range requirement (before the x) and the last integer dictating the reversal requirement. Both values are specified in tick increments.
Price Dependent Periodicities - Range Bars, Change Bars, Point and Figure, Renko
Price dependent periodicities are those where each bar comprises the price action that occurred during some movement in price. That price movement can be expressed as a given high low range (Range Bars) or a given change from open to close (Change Bars). For Renko and Point and Figure periodicities, price must retrace a given amount in order to complete a bar. In these periodicities, the volume and time of each bar can vary greatly, while the price movement of each bar is kept essentially constant.
Range Bars are price-driven bars, with each bar having a required minimum high-low range. Once the range requirement is reached, the first tick to break outside that range will begin a new bar (and become the opening price of that new bar). A 0.75 Range Bar chart of ES with volume can be seen below.

Notice that the height/range of each bar is 0.75. Also notice that each bar opens at a price outside of the high/low range of the previous bar. And last, notice that each bar closes at either it's high or it's low. These are the three rules of range bars.
- Each bar must have a high/low range equal to the range specified. The high/low range of a bar can exceed the range specified in certain situations (gaps) but can never be less that the range specified.
- Each bar must open outside the high/low range of the previous bar.
- Each bar must close at either it's high or it's low.
With Range Bars (and Change Bars), new bars will only be formed when price is moving. When prices gets stuck in a tight range for an extended period of time, horizontal screen real estate will not be wasted with multiple bars that would have formed had the periodicity been volume or time driven.
For Range Bars, the high/low range of each bar is essentially held constant, while time and volume are variables.
Change Bars are price-driven bars, with each bar having a required minimum open-close change (in either direction). Once the change requirement is reached, the first tick to break outside that change will begin a new bar (and become the opening price of that new bar). A 0.50 Change Bar chart of ES with volume can be seen below.

Notice that the magnitude of the open/close change of each bar is 0.50. Also notice that each bar opens at a price outside of the open/close range of the previous bar. And last, notice that each bar closes at either it's high or it's low. These are the three rules of range bars.
- Each bar must have a open/close change equal to the change specified. The open/close change of a bar can exceed the change specified in certain situations (gaps) but can never be less that the change specified.
- Each bar must open outside the open/close range of the previous bar.
- Each bar must close at either it's high or it's low.
For Change Bars, the magnitude of the open/close change of each bar is essentially held constant, while time and volume are variables.
Point and Figure Bars are price-driven bars. Point and Figure is supported in traditional charts as a periodicity and also as a drawing style. This significant enhancement marries the powerful features of the traditional chart window (indicators, buttons, multi-panes, etc) with this unique drawing style. The Chart Setup Wizard was revised to create Point and Figure charts with user selected indicators and moving averages. The wizard creates the Point and Figure chart with default reversal criteria of 3 boxes and box size determined automatically from the instrument setup. You can also use the periodicity menu to specify a specific box size and reversal criteria. Choose the .25x3 PNF sample periodicity from the periodicity menu and adjust the numbers if you wish. Note that the entered text must be followed by a space and the letter P, e.g. ".1x3 PNF" to be recognized as a point and figure periodicity.

Tokens have been added to RTL to support the PNF Periodicity. Scans, signals, and custom indicators operating with PNF periodic data can use these token to inspect the state of the PNF column for any PNF bar, the box size and the reversal criteria. To test the state of the PNF use the PNF_STATE token. Constants PNF_UP and PNF_DOWN were added to enable expressions such as "PNF_STATE == PNF_UP" or "PNF_STATE == PNF_DOWN". The PNF_BOX token gives you the box size of the PNF data for the instrument, PNF_REV gives you the reversal criteria (the number of boxes).
A so called "reversal tick" chart is simply a PnF charts with a box_size equal to a tick increment. For ES, a 12 tick reversal chart can there be obtained with the following settings. A "Change periodicity" button that would allow to switch between a 5,10 and 12 tick reversal is also displayed below. To make sure a reversal tick chart does not follow the conventional point and figure high and low values, one needs to make sure the configuration variable PnfConventionalHighLows is set to false (this is the default value for any fresh installation of I/RT 16 or higher)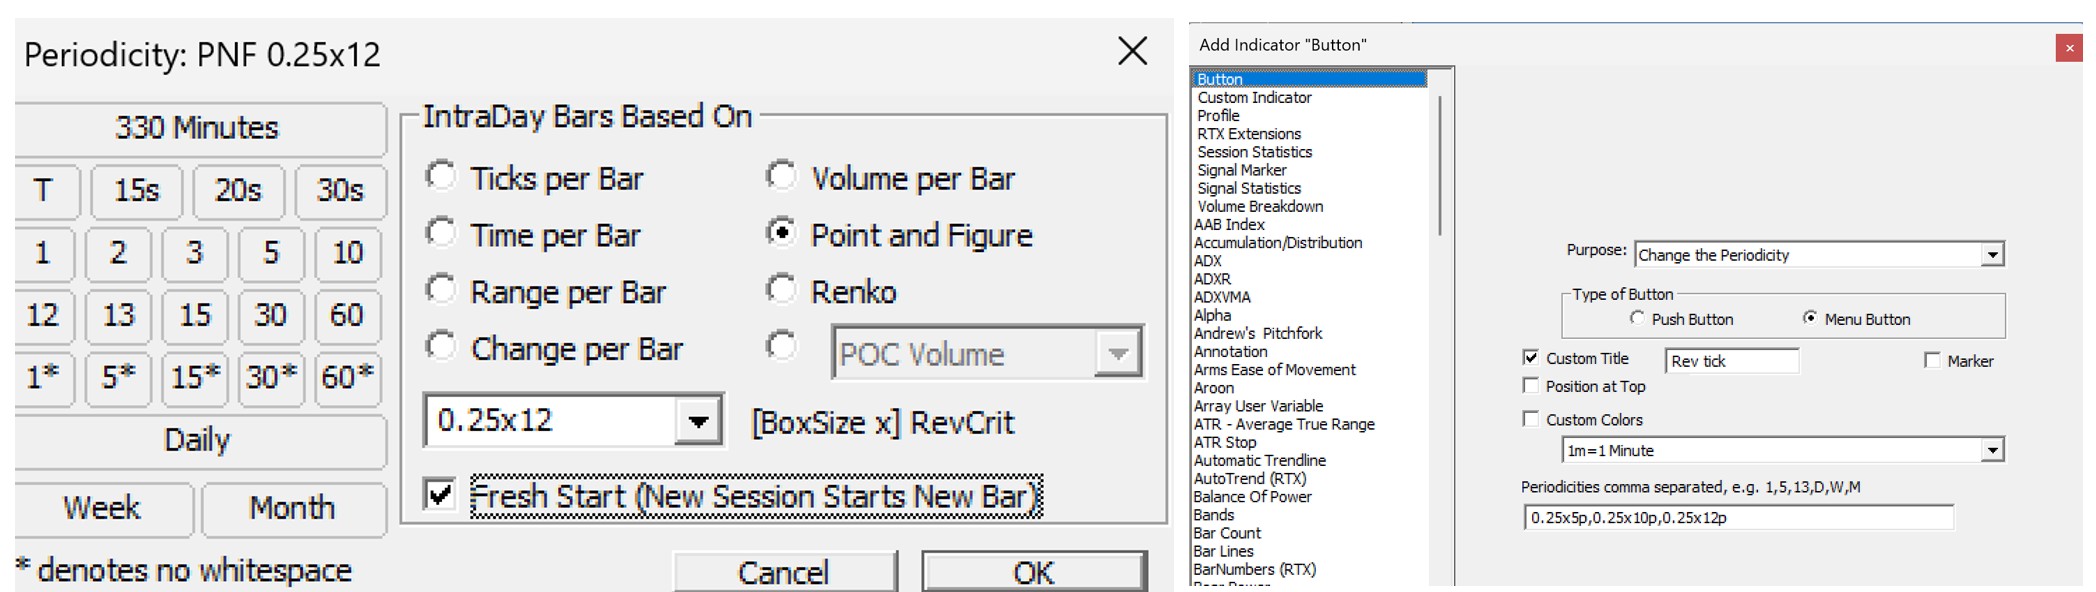
Renko Bars are price-driven bars. Renko is supported in traditional charts as a periodicity and also as a drawing style. This significant enhancement marries the powerful features of the traditional chart window (indicators, buttons, multi-panes, etc) with this unique charting style.

To change any existing chart to a Renko chart, simply double-click on the instrument (bars or candles) in an existing chart, and setup the chart with a Style of "Wickless Candles". Wickless Candles will result in the traditional Renko "boxed" look and feel. It will simply chart a box from open to close. Users may opt for the "Candlestick" style, a style that give the open/close box and provides additional information with the candle wicks representing the high and low of each bar. Once Renko is selected this option, then provide a box size in the space provided below. The box size can range from the tick increment of the instrument (0.25 for ES) to multiples of the tick increment (0.5, 1, 2, etc). In order to force each Renko box to be drawn perfectly square (the height of each box equals the width), double-click in the vertical scale to bring up the vertical scale preferences. Select the 3rd Scaling Method specifying "Automatic scaling with Square boxes". This option will keep the boxes square regardless of changes in chart dimensions, scrolling, or zooming. Some user may prefer the Automatic scaling method. It tends to make better use of the vertical space in a chart. Once you've setup your scaling as "Square Boxes", you can easily toggle to automatic by clicking the "RA" until it becomes an "A", and toggle back to square boxes by again clicking on the "A" until it turns back into an "RA". Investor/RT can be configure so that Renko bars reset at the beginning of each session (fresh start), or continue across session boundaries. The fresh start option is generally used for symbols that might gap heavily between session (and result in a long sequence of boxes to fill the gap). On symbols like ES that trade around the clock, the fresh start option is generally not needed or preferred. Go to "Setup: Preferences: Charts: General". If the "Continuous Tick & Volume Bars" checkbox is UNchecked, Renko charts will operate in "fresh start" mode. If it is unchecked, Renko charts will operate in "carry over" mode. Tokens have been added to RTL to support Renko. Scans, signals, and custom indicators operating with Renko periodic data can use these token to inspect the state and box size of the Renko boxes. To test the state of the PNF box use the RENKO_STATE token. Constants RENKO_UP and RENKO_DOWN were added to enable expressions such as "RENKO_STATE = RENKO_UP" or "RENKO_STATE = RENKO_DOWN". The RENKO_BOX token gives you the box size of the Renko data. As an example, the following signal would look for 3 consecutive up boxes followed by a down box: RENKO_STATE.3 = RENKO_UP AND RENKO_STATE.2 = RENKO_UP AND RENKO_STATE.1 = RENKO_UP AND RENKO_STATE = RENKO_DOWN. Here are some of the capabilities enabled by this Renko Charting improvement:
- Renko charts update dynamically tick by tick.
- True Renko square boxes built off tick data (or 1-min data)
- Build Renko charts using any box size
- Full library of over 150 built-in technical indicators to Renko charts, including Volume Breakdown, MPD, and TPO Indicators
- Full library of drawing tools, including 45 degree trendlines, reference lines, notes, Fibonacci, pivots, regression, and much more
- Add custom indicators writing in Investor/RT's RTL language (Targets)
- Write signals, add markers and alerts to Renko charts
- Write trading systems and backtest historical Renko data
- Flexible scaling, zooming, scrolling, and panning with drag and drop
- Keyboard and mouse wheel shortcuts for convenient manipulation of Renko charts
- Review historical Renko charts, going back weeks, months, or even years (varies with data vendor)
- Floating charts that may be dragged outside the Investor/RT task window
- View data from other periodicities (minute bars, tickbars, etc) on Renko charts
- Other helpful tools such as multi-chart highlighter, crosshairs, infobox, custom buttons, and multi-linking
- Autotrading available via the Trading System Indicator to limited brokerages
- Quickly switch chart between Renko and other periodicities (P&F, tickbar, minute bar, volume bar, daily, etc)
- All in one chart: Renko, P&F, TPO Profile (TPO indicator), Delta (Volume Breakdown Indicator), Other Periodicity Data, drawing tools, historical indicators, markers, alerts, and much more, with each bar having a required minimum open-close change (in either direction). Once the change requirement is reached, the first tick to break outside that change will begin a new bar (and become the opening price of that new bar). A 0.50 Change Bar chart of ES with volume can be seen below.
Volume Bars are volume-driven bars, with each bar having a required minimum volume. Once the volume requirement is reached, the next tick/trade will initiate a new bar (and become the opening price of that new bar). A 5000 Volume Bar chart of ES with volume can be seen below.

Notice that the volume of every bars is the same. All bars have the are built of exactly 5000 contracts. The current bar will obviously have less than the required amount of volume while it is forming.
For Volume Bars, the volume or each bar is held constant, while price and time are variables.
Minute Bars - Each bar reflects trading activity during a user-specified number of minutes.

Second Bars - Each bar reflects trading activity during a user-specified number of seconds.

Tick Bars - Each bar reflects price action over a user-specified number of trades/ticks.

Tick (Connected Line) - Each point/dot reflects one trade/tick.

Daily Bars - Each bar reflects trading activity during one day.

Weekly Bars - Each bar reflects trading activity during one week.

Monthly Bars - Each bar reflects trading activity during one month.

Mixed Periodicity Indicator (MPD)
Investor/RT's MPD Indicator enables you to add indicators to charts of one periodicity where the indicators are calculated using data of a different periodicity. This powerful feature is described in more detail here.