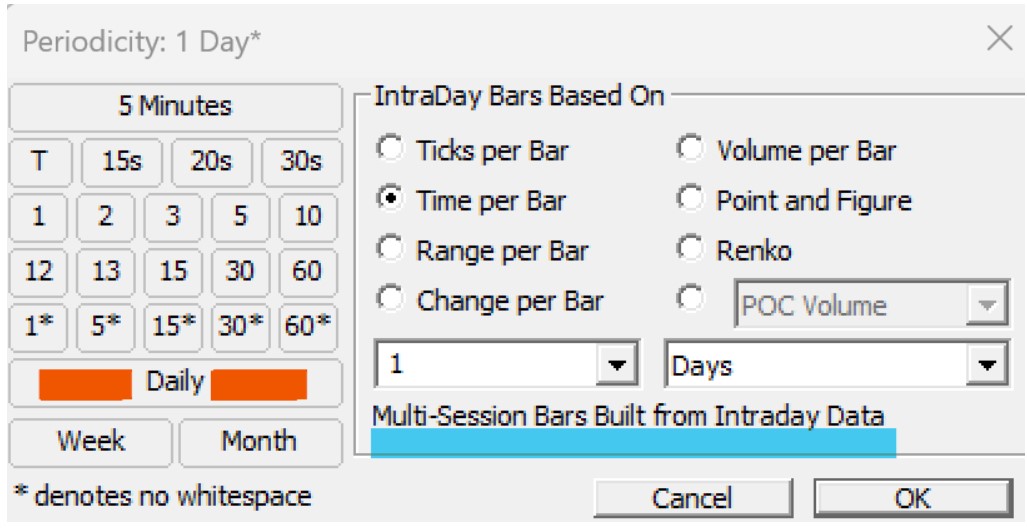
The difference between Daily and 1 Day* Periodicities
This topic is also discussed in this video : Daily bars honoring day session
This topic is also discussed in this video : Daily bars honoring day session
Periodicity is defined as the character of being periodic; the tendency to recur at regular intervals. Applied to market data analysis and Investor/RT in particular, the periodicity of a chart relates to the manner by which the periodic intervals of market data are determined. All the trading within an interval is defined as a bar, each bar having an open price, high, low, close and volume of trading during the interval. This tutorial presents the extensive range of periodicities available in Investor/RT. Periodicities are grouped into three categories: time dependent, volume dependent, and price dependent.
Many of the tick-based periodicities provide a Fresh Start option within the periodicity control. These periodicities include Tickbars, Volume bars, Rangebars, Renko, PNF, etc. When fresh start is available, you will see a Fresh Start checkbox at the bottom of the periodicity control as you see below:
Let's assume for our example that you would like to set the box size to $0.25 for stocks trading under $5, $0.50 to stocks trading between $5 and $20, and to $1.00 for stocks trading over $20. The following scan will accomplish this.
There are actually multiple ways to do multiple periodicities.
Let's use the specific example above of overlaying a 5-minute stochastics on a 1-minute chart. Let's further assume that we are specifically after the "Fast %D" component of that 5-minute stochastics.
Using Mixed Periodicity Data Indicator (MPD)
Once solution (and probably the most popular solution now days) would be to use the Mixed Periodicity (MPD) indicator. You can access additional information on MPD at:
- Effective with the release of Version 12, this article is no longer applicable.
Investor/RT Version 12 and higher adopts the convention that the size of the range or change of each bar be expressed as the number of tick increments of range or change. In Version 11, range/chart bar periodicity has been expressed differently, as the number of prices within the range bar, a number that is one greater than the number of tick increments in the range.