This topic is also discussed in this video : Daily bars honoring day session
"Daily" periodicity
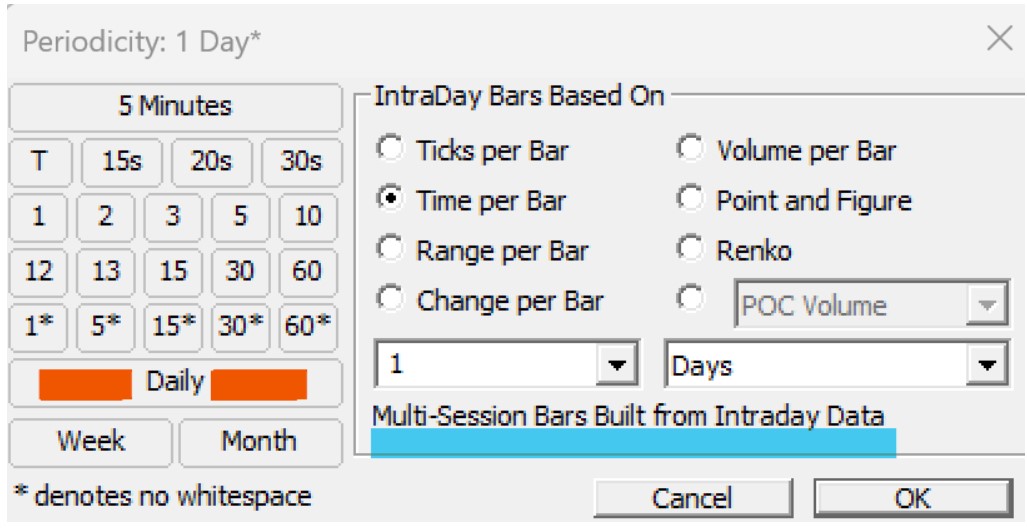
When you set up a chart with a Daily periodicity (see option highlighted in red above) , Investor/RT downloads Daily bars from the exchange and receives back 5 values: Open, High, Low, Close and Volume for the session. These values are calculated by the exchange using what they deem to be the official open and closing price and the Volume that occurred between the Open and Close. For future markets, the closing price will reflect the Settlement price as per each exchange regulation close time. The OHLC data for Daily bars are not linked to any of the full or day session settings you have defined in your chart (or instrumlent setup window) in Investor/RT, but are only linked to the symbol itself.
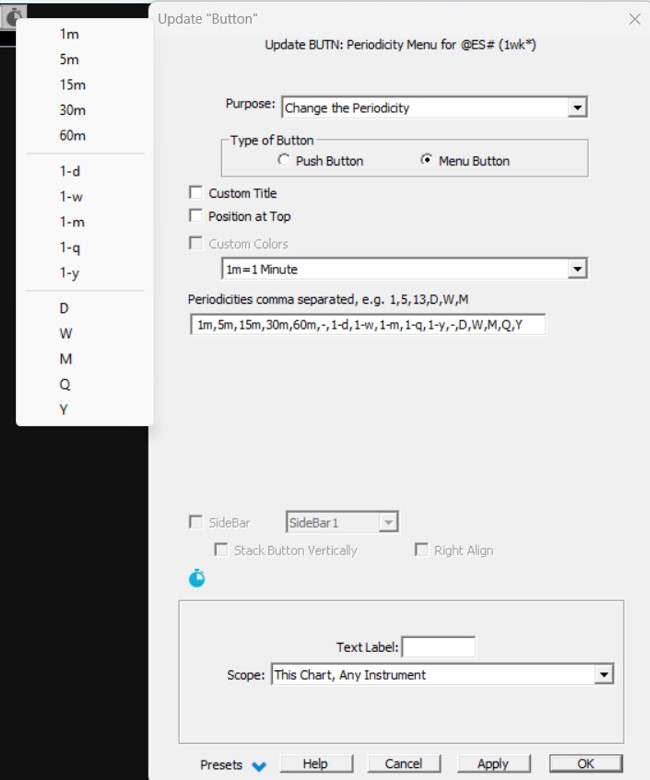
Charts having "Weekly", "Monthly", "Quarterly" of "Yearly" periodicity will be built by aggregating from "Daily bar" data. When using the chart periodicity menu button, these day bar-derived periodicities are available through the letters D, W, M, Q and Y
"Daily" periodicity built from intraday data (1 Day *)
If you want to be more specific with your analysis, especially if you intend to display TPO charts or use the Volume Profile indicator, or use the MPD indicator (referring to specify daily RTH session bar data for example), use the periodicity called 1 Day* (or use a periodicity of the number of minutes in your session). When using the "1 Days" option (highlighted in Blue above), Investor/RT builds a Daily bar for you using 1 Minute data (or from tick data if you have such data stored in your database).
To be 100% clear, the OHLC data of a 1d* candle chart will be based on the chart session you have selected. IF you use a typical Chart button to switch between Full and Day Session, the daily OHLC data will adjust accordingly. Using this method, the closing price will be the Last Price observed when the "chart session" closes, and there will be no adjustment after that.
Remark : to display a long term Volume profile indicator on top of a chart with a daily periodicity, it is essential to use the 1 Day* periodicity and not the "Daily" periodicity.
Similarly, you may display weekly, monthly, quarterly or yearly bar charts using intraday data (with the same periodicity menu). When using the chart periodicity menu button, these intraday bar derived periodicities are available through the letters 1-d, 1-w, 1-m, 1-q, 1-y (for a 2 week periodicity, just use 2-w)
Be aware of the resulting difference in chart display when using each option.
Here is a quick video about using button to change the chart periodicity