While realtime data feed providers such as IQFEED or eSignal send every trade (tick) along with associated bid & ask, some brokers or data providers (such as Interactive Brokers, TDA/TOS or TradingView) send what they call "snapshot" quotes every 300ms (or so) in active markets. The pricing data is a compressed snapshot of all trades that occurred within that 300ms (3/10ths of a second). So if 5 ticks occurred very close together, they might all be sent in as a single snapshot quote, with Investor/RT, in turn, treating it as a single tick or trade.This certainly affects several chart type, like constant tickbar charts, that rely on the number of trades to form its bars. It will also affect any indciator (such as the Volume Breakdown indicator) that relies on processing every trade along with its bid and ask price in order to divide volume into bid or ask volume.
Now, if the symbol does not trade frequently, with trades generally happening only once every second or more, then the effect will be much less noticeable, if noticeable at all. It's important to realize that if you are using DTNMA as your historical data backfill service, when you back fill, some of your charts and indicators that rely on tick data may look differently than they did a minute earlier when they were just built on "snapshot" Data. This is because DTNMA data is true, unfiltered tick data.
Here is a good example....comparing IB quotes (on the left) with those from eSignal (on right). These were collected real time:
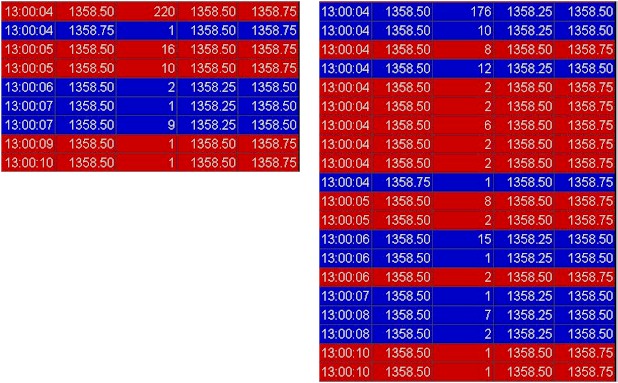
Notice the first trade for IB comes in as 220 contracts traded on the bid. However, eSignal sent in 9 different trades making up those 220 contracts, with some trades coming in on the bid, and some coming in on the ask. In the end, both data feeds sent the same amount of volume, but IB sent only 1 trade to eSignal's 9 (which would obviously effect tickbar charts), and IB sent in 220 contracts all on the bid, contributing a -220 to the delta value of the Volume Breakdown indicator, while eSignal sent in 198 contracts on the ask, and 22 on the bid, resulting in a +176 delta value for the VB indicator.
While this is somewhat of an extreme example, when trading a liquid contract like the ES, multiple trades will commonly be consolidated into one (snapshot), and result in a discrepancy between feeds in a number of data related areas, including those highlighted above.
In addition, when downloading tick data from InteractiveBrokers, the bid and ask information is not transmitted. So Investor/RT is not able to discern between bid and ask trades when looking at downloaded data. For this reason, Investor/RT users with the IB feed are encouraged to take advantage of the DTNMA historical service. DTNMA works seamlessly with IB, with all download requests routed automatically to DTN instead of IB.
Over a randomly observed 50 minute period, while 2477 trades come in through eSignal (on ES), only 1412 trades came in via IB. While the total volume is almost exactly the same, the deltas show quite a difference, with eSignal showing a delta over that period of 4999 (16881 x 21880) and IB showing a delta of 3714 (17136x20850). A user watching a tickbar chart would get approximately half as many bars with IB over this periods, than with eSignal.
To recap, if tickbar charts, or delta values (ask minus sell volume) are of critical importance to your style of trading, then IB might not be good data service for feeding Investor/RT, and you might want to consider one of the other data source options. However, if these aspects of the program are not very important to you, then IB may be more than adequate.