
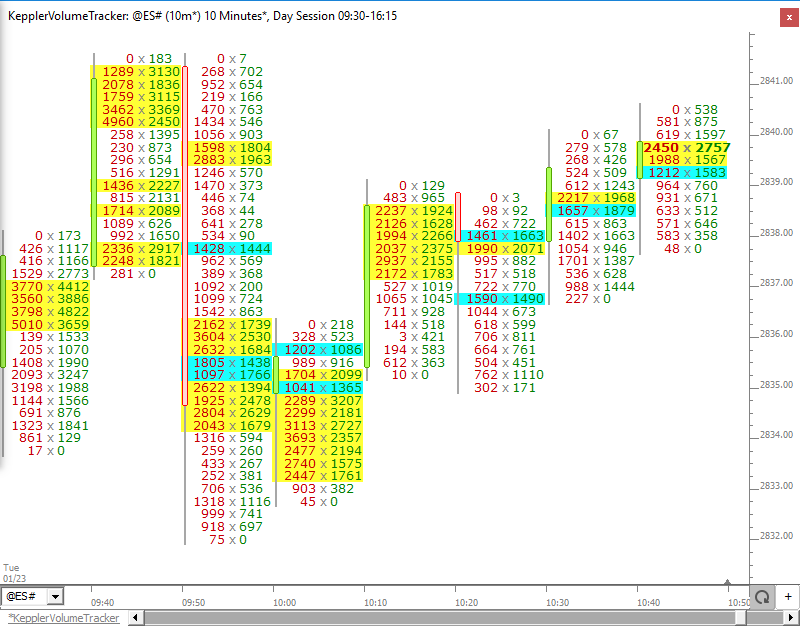
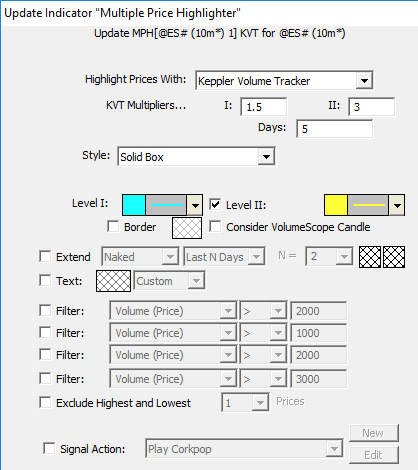
The Keppler Volume Tracker (KVT) is part of the Multiple Price Highlighter (MPH) Indicator. KVT was designed in collaboration with Dr. John Keppler, author of Profit With The Market Profile. KVT looks for prices whose volume is above the average by a user specified number of standard deviations. Two levels of standard deviation multiples are provided by the user: Level I and Level II. The user also specifies the period (number of days) over which to compute the average volume at price and the standard deviation of volume at price. In the chart below, Level I prices have volume at price at least 1.5 standard deviations above the average and Level II prices have volume at price at least 3.0 standard deviations above the average volume at price. MPH is a powerful indicator which has the a great deal of flexibility to identify a wide array of volume at price conditions. The MPH settings for the chart below can be seen below the chart. Here is the chart definition: https://www.linnsoft.com/charts/kepplervolumetracker-es
KVT works on time-based periodicities such as 1 minute, 5 minute, 15 minute and 30 minute bars. Time-based periodicites are required as the averages and standard deviations are computed using the same time periods each day. KVT will not function on non-time-based periodicities such as Renko, Tick Bar, and Volume Bar.
(Note: This chart also contains the VolumeScope® Indicator which presents the buying and selling volume at price as text (along with the candle). For more information on VolumeScope, visit: https://www.linnsoft.com/techind/volumescope-rtx
In this video, Dr. John Keppler explains the Keppler Volume Tracker (KVT) which was implemented inside the Multiple Time Highlighter of Investor/RT with his guidance. KVT helps identify high volume participation and activity in the market when it occurs by comparing volume at price at each interval of time to a historical average of the same interval of time of past session.
Another great feature of IRT!!