Hi Chad
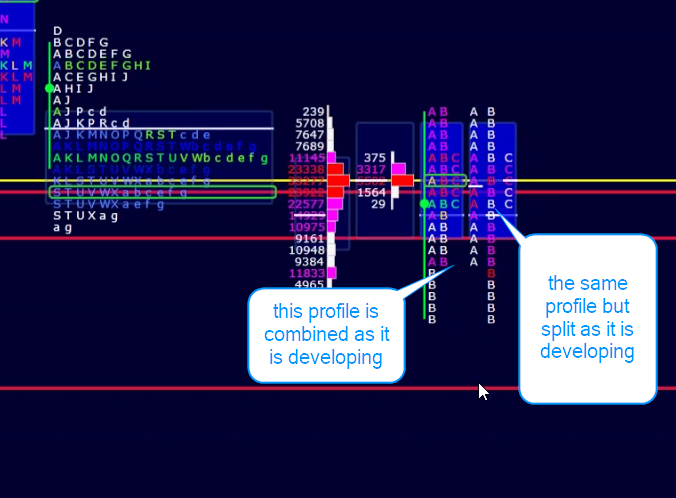
is there a way to have a split letters and one combined profile in the same chart where you don't have to toggle the profile to see the way the profile looks before you split at the letters so basically just have one is developing where ll the letters are not split and next to it the split letters for the day in development.
I have attached a screen image to show you what I'am talking about
Thank you
There is no option currently to show both the split and unsplit letters side by side. I'll give you a few alternatives that are available below.
Obviously this is possible in some form using the Profile Indicator in multi-pane charts. And when you do so, it opens up an enormous amount of additional functionality and flexibility. This page discusses that alternative: https://www.linnsoft.com/tips/emulating-market-profile-multi-pane-charts-3
The downside it is lacks the actual letters (just the shape) and is a little more challenge to accomplish merging or splitting profiles if that is a need (although there are now ways to make this happen). Below is a very simple implementation. 30 minute chart showing the TPO Profile (time-based). You get the same shape you do on the stand alone chart, you can see the profile over the split brackets (candles)....you actually get quite a bit of additional info like open and close of bar, and you have access to 200 indicators and drawing tools at your disposal when you go this route.
But back to the standalone TPO Profile charts. While there is current no such option, you can split the profiles while viewing the volume profile behind the letters as seen below. It might be possible to add an option to show instead of a volume profile, and profile representing the time-based (TPO) profile. They would still be histograms but show you the shape behind while also viewing the split brackets. Let me know if that might be something of interest to you.
The chart below gives you a small sample of some of the functionality this opens up to you when you use the Profile Indicator in Multi-Pane charts. In the lower 2 panes are volume (of bracket) and delta bars. The split brackets (bars) show the letters/TPOs. A VolumeCandle on the right show the volume at price of last 3 bars as text next to candles. BuySell Meter shows the buying and selling volume of curent session. Green dots show where each bracket closed.
https://www.linnsoft.com/charts/tpo-multipane-es-1
Look for an option to draw TPO letters in the Profile Indicator in 12.7.4.
Thank you Chad
you"ve always came through in anything the community asks of you I really appreciate this and I appreciate the fast responses and the fast solutions
Thank you again
keep up the good work
Since you began this topic, I've made significant progress on the 2 items that can generally prevent TPO Profile traders from using the Profile Indicator: Letters, and Splitting/Merging. I've moved past both of these hurdles and you can expect a solution on both fronts in the near future. That will really open things up for TPO Profile traders.
I use the standalone TPO profile chart extensively, which I have always found to be a valuable trading tool, especially if you have studied Market Profile theory. One thing that I have not been able to obtain though is the TPO count above and below POC - is there a checkbox in the TPO preferences tab that will allow me to get this data?
If you turn on the infobox (tab key toggles that on/off) you can then point at any price within any profile, and the infobox will tell you the number of TPOs at that price, above that price, below that price (as well as volume and delta at/above/below). See below.... So you can do this for any price in any profile, not limited to TPOs.
Yes of course, it's in section 2 of the InfoBox - apologies for wasting your time!
I wanted to update this topic to introduce the Boundaries and Colors RTX indicators. The Boundaries indicators enables easy split/merging of TPO Profiles via the Profile Indicator. And the Profile Indicator now has a TPO/Letter option which can be fed and customized via the Colors Indicator. Use the links below to learn more about Boundaries and Colors.
Boundaries Indicator
Colors Indicator
Hi @Chad,
Is there an option which helps us track the halfback for the period and for the session within the market profile?
Pages