This Tutorial will demonstrate how to paint technical indicator lines and histograms based on whether a given condition/signal is true or false. The topics that will be covered include:
- Building a Custom Indicator (CI)
- Overlaying the CI on an existing Technical Indicator (TI)
- Using the "Connect Non-Zero Values" option of CIs
This process can be used to paint basically any technical indicator, based on any condition/signal. In this specific example, we will first paint a 10-period Moving Average (10-period) line based on whether that line is above or below the 20-period Moving Average. First, we'll create a custom indicator which will be used to paint the areas where our 10-period MA is above the 20-period MA. From the main menu, choose "Setup: Custom Indicator". Enter the following syntax for the custom indicator:
MA * (MA > MA_B)
Click the "Save" button. You'll be asked for the preferences of both MA and MA_B. Setup MA as a 10-period on the Close, and MA_B as a 20-period on the Close. Save the CI with a name like "MA_Above_20MA". This custom indicator will essentially have a value of MA whenever the 10-period is above the 20-period, an a value of 0 when the 10-period is below the 20-period.
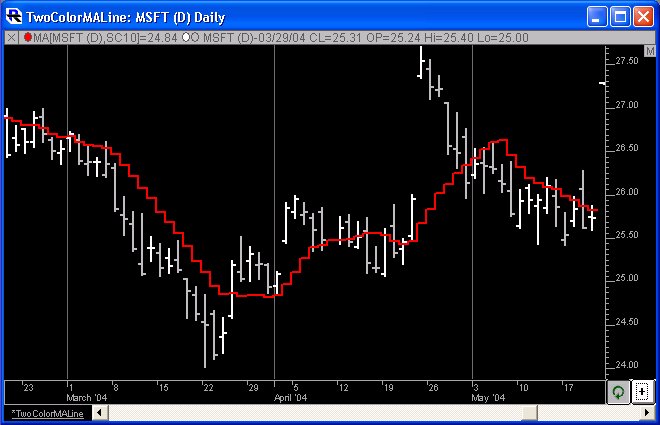
Now, go to any chart and add a standard 10-period Moving Average to the chart, overlaying the instrument as seen in the chart below. In this example, let's choose the line style of "Line, Stepped" and choose red as both the up and down colors. The result should be something similar to the chart seen below.
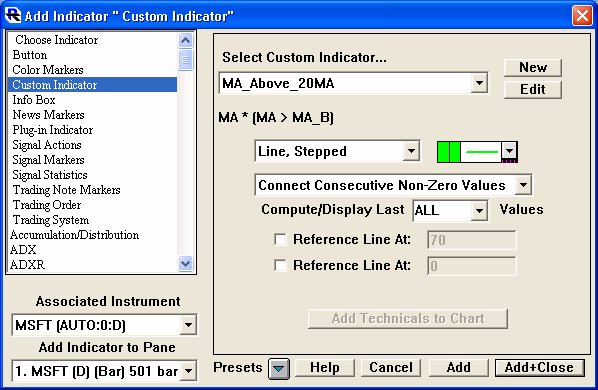
Now, we need to add the Custom Indicator we created above to the chart as well. Open the "Add Indicator" window and choose "Custom Indicator" from the list on the left. Select the "MA_Above_20MA" indicator that we just created from the list. Select a line style again of "Line, Stepped", this time setting both colors to green. Select "Connect Consecutive Non-Zero Values" from the list below the line styles. This is the key to this process. By choosing this option, we are telling Investor/RT to only recognize the non-zero values, and to only draw the connecting lines between the consecutive non-zero values. This will give us the "painted line" effect we're after. As we mentioned above, the CI will only be non-zero (and equal to MA) when the 10-period MA is above the 20-period MA.
Also make sure to specify in the lower left corner to add the indicator to the same pane that contains the original Moving Average. The Add Indicator window should look something like this:
The resulting chart should look like this:
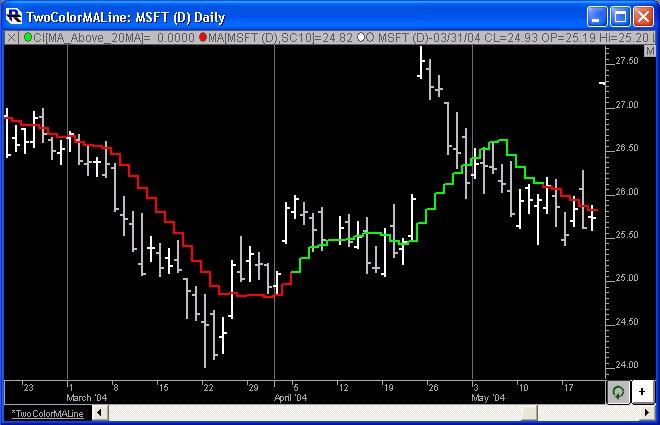
Notice the line is "painted" green whenever the 10-period MA is above the 20-period MA, and painted red otherwise.
Reviewing what we've just done in a general sense, we take any Technical Indicator "TI", along with any condition/signal "COND" which we want to use to paint the TI, and combine them in a custom indicator with syntax:
TI * (COND)
Then add simply overlay the CI on the TI in chart, using a stepped line style and different color from the TI, and making sure to specify "Connect Consecutive Non-Zero Values" in the CI preferences. In the CI above, TI can be substituted by an technical indicator token (CCI, MA, RAWK, MACD, etc) and COND can be replace by any true/false expression (CCI > CCI.1, MA > MA_B, RAWK > FASTD, MACD > 0).
Next, let's look at another example where we'll paint a CCI histogram green when the values is above 100 or below -100, and blue otherwise. Again, let's create a custom indicator...this time with the syntax:
CCI * (CCI > 100 OR CCI < -100)
This indicator will result in a value of CCI whenever CCI is either above 100 or below -100, and 0 otherwise. Save this CI with a name like "CCI_Outsides". Now, back to our chart, add the CCI technical indicator choosing a drawing style of "Histogram, Solid" and choosing both up and down colors of blue. The chart should look something like this:
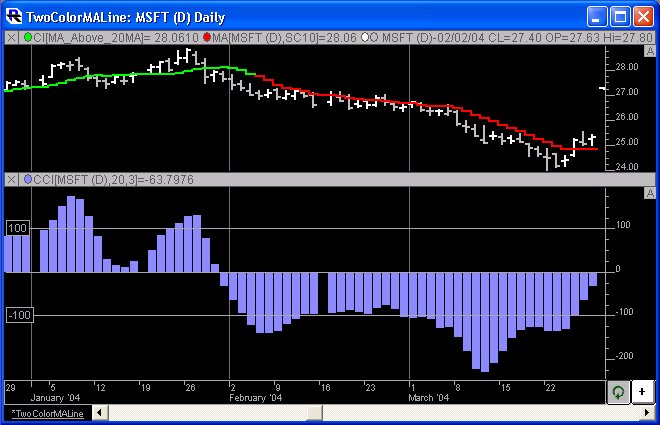
Next, add the custom indicator similar to the way we did in the example above, except this time, select a drawing style of "Histogram, Solid" and both up and down colors of green. Choose to add the indicator to the same pane as the existing CCI histogram resides (if you add the CI to the wrong pane, you can always drag and drop it into the right one). Your resulting chart should look something like this:
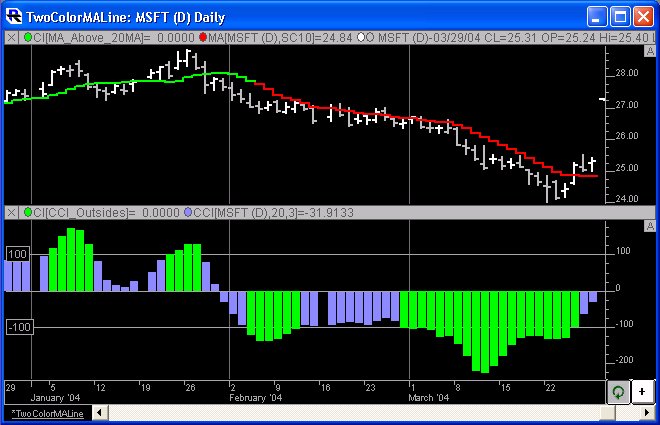
Notice that the histogram bars are painted green whenever the value of the CCI is above 100 or below -100.
If you prefer to paint only the "tips" (outside of 100 and -100), try repeating the procedure above, except this time, use the custom indicator syntax:
(CCI > 100) * 100 + (CCI < -100) * -100 + (CCI <= 100 AND CCI >= -100) * CCI
Which will result in the following effect:
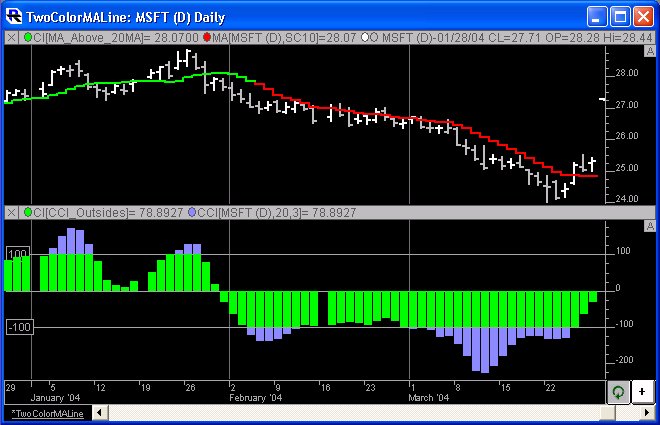
The trick here is to create a custom indicator which will clip any values above 100 back to 100, and any values below -100 back to -100, and otherwise leave the CCI alone when it's between the lines.
Related: Paint Bars Color Markers Signal Markers Price Bands Painting Bars and Background

