See also: Custom Column Feature Column Tutorial: Linear Regression Bands
(Note: While the tutorial below can be very helpful in learning more about scans, schedules, and custom V# variables, this method of creating custom columns has largely been superceded by a built-in custom column mechanism. To learn more about this built-in custom column feature, please read the Three Line Break - Custom Columns tutorial.)
This Tutorial will demonstrate how it is possible within Investor/RT to create custom columns in quotepages which will monitor any user specified value, including technical indicators. The columns may be set to anything the user can express using the Investor/RT RTL language. The tutorial below may seem lengthy and involved, but the whole process is actually quick and simple once you've learned the basics behind it. In this specific example, we will add four columns to a quotepage which will track.....
- MACD (Moving Average Convergence/Divergence)
- SLOW-D (Stochastics)
- LRS (Linear Regression Slope)
- 20 Minute Percent Change
Tutorial will be helpful in the following areas..
- Creating Scans using the SET token
- Creating Schedules to Automate Scanning
- Using User Variable (V#) Columns in Scans and QuotePages
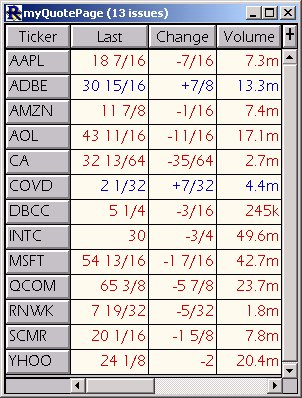
Let's start with a simple quotepage. This quotepage contains 13 stocks and is named simply "myQuotePage" as can be seen on the left. This is the quotepage to which we eventually would like to add four custom columns containing the data we discussed above. This quotepage will also be the one we use as the object quotepage for our scan. In summary, what we are about to do, is first create a scan which will set the user variable (V#) columns to our desired values. We will then assign this scan to a schedule so that it will run every 5 minutes throughout the trading session, resetting our variables each time it runs. Then we will give our user variable (V#) columns descriptive names. And finally we will add them as columns to our quotepage so that we may view, and even sort, the values.
Now, let's create a new scan with the following syntax...
SET(V#1, MACD) AND SET(V#2, LRS) AND SET(V#3, SLOWD) AND SET(V#4, 100*(CL-CL4)/CL4)
Select the quotepage "myQuotePage" as the object quotepage for the scan and choose to run the scan on 5 minute data. You should note that if you also choose to run this scan on 5 minute data, you should make sure you have a day or two of valid intraday data on the symbols in your quotepage. Otherwise, you can choose to run the scan on Daily data for just for the sake of this tutorial.
Now click on the "Save" button. You will be asked for the preferences of the indicators involved in the scan. These preferences are really up to the discretion of the user and you may just want to use the defaults or mimic the preferences as you can see in the scan window below. The last window will ask you to supply a name for you scan and I have chosen to call mine "SetIndicators". The resulting scan window should look something like this....
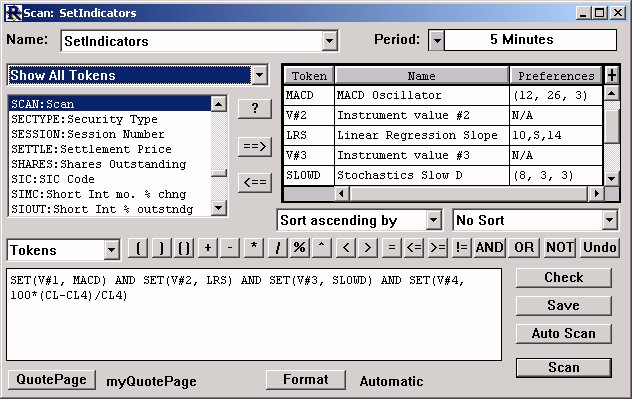
Let's quickly examine what each of these SET statements is doing. The first three are very similar. The first one, SET(V#1, MACD) is setting the user variable V#1 to the value of the 5-Minute MACD using the preferences you specified for MACD. It is setting this V#1 value for each of the symbols in your specified quotepage. The second one, SET(V#2, LRS) is setting the user variable V#2 to the slope of the 5-minute linear regression line (in this case, a 14-period line). LRS is expressed in price per bar. In other words, an LRS of 0.034 would mean that the linear regression line is rising at a rate of 3.4 cents per bar, while an LRS of -0.025 would mean the linear regression line is falling at a rate of 2.5 cents per bar. The third set expression, SET(V#3, SLOWD) is setting the user variable V#3 to the value of the 5-minute stochastic SLOW-D value using the preference you chose for the SLOWD. Finally, the expression SET(V#4, 100*(CL-CL4)/CL4) essentially sets the user variable V#4 to the 20 minute percent change. CL4 represents the closing price of the fourth bar back, while CL represents the closing price of the current bar.
Now that we hopefully have a basic understanding of what the scan is doing, let's move on to scheduling our scan. From the main menu, choose "Setup Schedule". First, let's create a new schedule. Click on the "New" button below the list of schedules (which may be empty if this is your first schedule). Let's give it a name of "SetIndicators" and choose to run it every 5 minutes during the the US Stocks session. Your schedule setup should look something like this....
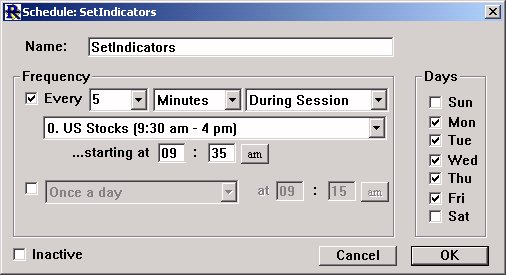
Now click "OK". Let's now add our scan to this new schedule we've created. With our "SetIndicators" schedule selected on the left, click on the "New" button under the "Actions" list (which should be empty). 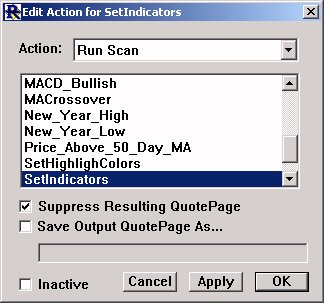
Choose "Run Scan" from the Action list, and then choose our "SetIndicators" scan from the list of scan names below. Let's check the "Suppress Resulting QuotePage" checkbox so that we won't be bothered by a quotepage every time this scan runs throughout the trading session. Instead, we will just keep our quotepage open and add the custom columns to it. You can now click "OK" to complete the addition of your Action to your Schedule and you should now see the Action "Run Scan SetIndicators" in the Action list on the right. We are now done scheduling our scan. Every five minutes during the trading session, this schedule will run, causing the scan to run and update our custom user variables. If, at any time, you wish to turn off the scheduled scan for whatever reason, you can inactivate the schedule by first double-clicking on the schedule name in the list and then checking the "Inactivate" button. You might want to click "Run Now" once under schedules just to force your schedule to go ahead and run once to set your user variables. Click "OK" to exit the schedule window. Your schedule will run automatically with or without this window open.
Now we are ready to give descriptive names to our user variables (V#). From the main toolbar, choose "Setup Prefs: User Variables". This window allows us to customize the column names that will be shown when we add our custom columns to a quotepage. First, click on V#1 in the list on the left. On the right, under the text "Column Title for V#1", type in "MACD" and choose a display format of four decimal places (99.9999). Now click "Apply". Now repeat this process for V#2, V#3, and V#4 as follows...
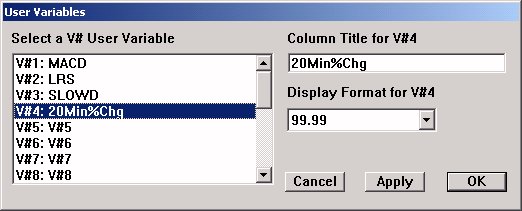
V#1:MACD:99.9999
V#2:LRS:99.9999
V#3:SLOWD:99.99
V#4:20Min%Chg:99.99
Now click "OK" to close the User Variable window.
We are now ready to add our custom columns to our quotepage. I will return to the quotepage I referenced above "myQuotePage". In the quotepage toolbar, click the "Add a New Data Column"  button. In the list that pops up, choose the "V#1(MACD)" column, and then click "Apply". Now, repeat this process adding "V#2(LRS)", "V#3(SLOWD)", and "V#4(20Min%Chg)". Then close "Add Column" window. You may move your columns around by dragging and dropping, and your resulting quotepage should looks something similar to the one below.
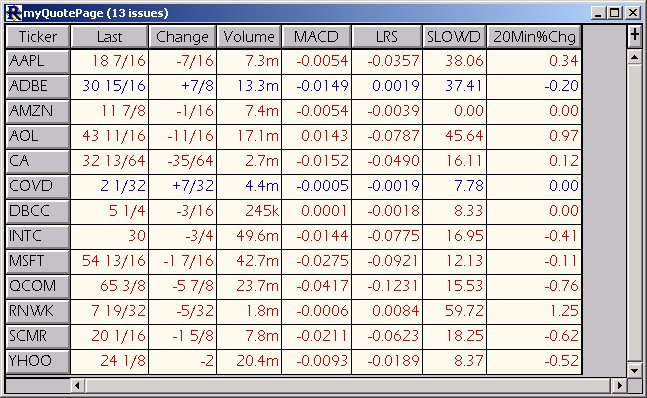
The four custom columns should update every 5 minutes as the scheduled scan runs. You can choose to run your schedule more frequently if you wish by changing the schedule setting to run every minute or less. You can sort each of your new custom columns by simply clicking on the column heading (MACD, LRS, etc.). Click once to sort ascending, then again to sort descending, then again to go back to ascending, etc. You can even set the quotepage up to automatically sort on any of these columns using the quotepage preferences.

