Sectional Quotepages
SUBMITTED BY william-linn at 2023-03-08 14:23:08 America/New_York time
Sectional QuotePages


Sectional QuotePages

This video demonstrates three different methods for creating quotepages, or lists of symbols, for use in the QuoteBoard Indicator.

This video illustrates how to create customized columns and add them to quotepages.
This video is going to discuss how to manage different objects in an Investor/RT, including symbols, quote pages and charts.
The following steps will guide you through the process of setting up a quotepage to calculate and monitor these Option Analysis values:

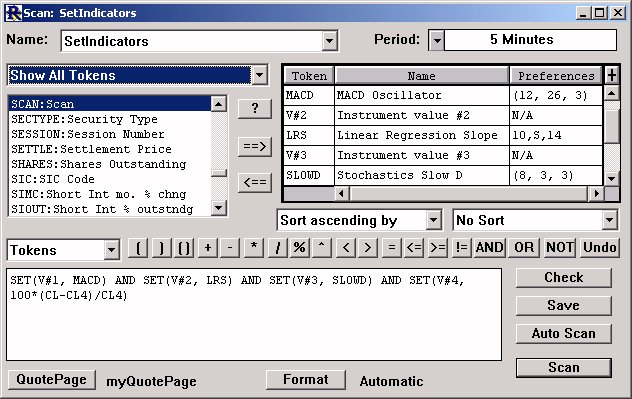
This video demonstrates how to setup a column in a quotepage which monitors the proximity of price to any key price or level. In this example, we demonstrate how to measure the proximity to the previous weeks weekly volume point of control (pWVPOC). This video brings together the features of custom columns, quotepages, user variables, scans, profile indicator, and vertical smoothing.

This video demonstrates how to use the Correlation Coefficient Indicator in a QuotePage column to measure the correlation between a benchmark index such as the S&P 500 and a group of stocks

QuotePages are spreadsheets showing columns of data on user-specified lists of symbols. This video demonstrates the basics of quotepage management and manipulation, including adding/removing symbols or columns, and much more.
This is Part 3 of the Three line Break Tutorial
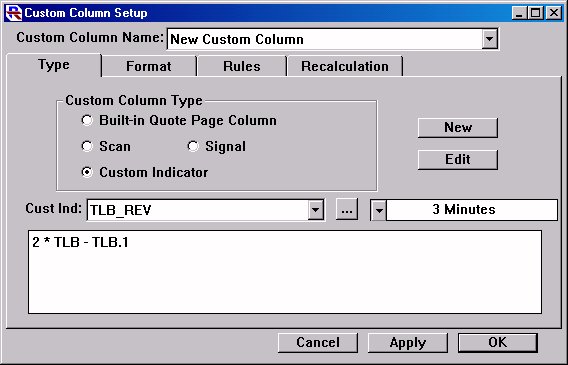
Now, let's create a Custom Column that builds off the TLB_REV Custom Indicator that we've already created, and then add this custom column to a quotepage.