The following steps will guide you through the process of setting up a quotepage to calculate and monitor these Option Analysis values:
- Implied Volatility
- Historical Volatility
- Theoretical Value
- Delta
- Gamma
- Theta
- Vega
- Rho
- Lambda
-
Setup a new quotepage format that will be used for options quotepages.
 Go to Setup:Preferences, choose "Format Definition", and click "OK". Select "New Format" for the format name. Add the following Data Items(in the order shown below) to the right list box. Ticker Symbol, Name, Theoretical Value, Last, Implied Volatility, Volatility, Delta, Gamma, Theta, Vega, Rho, Lambda,Days to Expiration Choose "Save As", and type in the name "Options Format" and click "Save". Close the "Setup Formats" window.
 -
Go to Setup:Preferences and choose "Option Analysis Preferences".
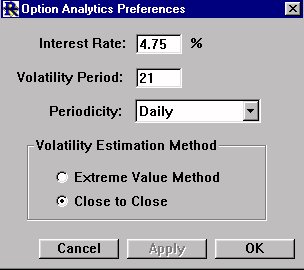
Fill in the risk free interest rate(e.g. 4.75). For Volatility Period, enter the number of periods to use when calculating the volatility of the underlying equity instrument. The default value is 21 periods. For Periodicity, choose whether you would like to calculate volatility using Daily, Weekly, or Monthly data. Finally, choose which method to use when calculating volatility. The Extreme Value Method compares highs and lows for each period, while the Close to Close Method compares closes on consecutive periods. Click "OK" to close the window.
-
The next step is to create a new Quotepage for the options we want to analyse. Click on the QP
 button in the main toolbar, and choose "New". Close the "Add to QuotePage" window that appears, as we will be adding options using a different method. Click on the "Change Format"
  button in the quotepage toolbar, and choose "Options Format". The quotepage should now be formatted properly for options. Leave the empty quotepage open.
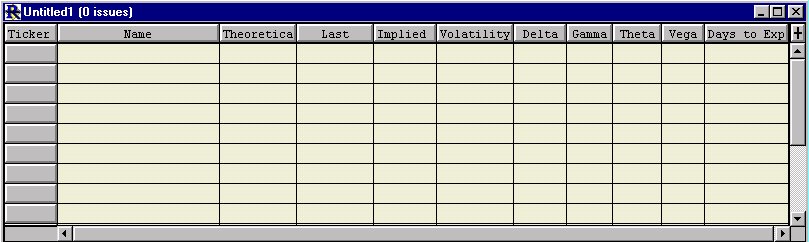
-
In order for the Options Analysis values to be calculated correctly, ensure that you have enough valid historical data for the underlying instrument. You may add IBM to the options quotepage by clicking the "Insert a Row"
 button on the quotepage toolbar. Type in "IBM" and press "Return". You can now double click on the IBM ticker symbol to view a chart on IBM. If you chose to calculate volatility based on 21 periods of daily data, then ensure you have 21 periods of valid data on IBM in your chart. If not, Investor/RT will have difficulty calculating the "greeks" values because they are all based on the volatility calculation. You must be set up to receive options data from your data service, and your data feed must be active. As quotes are received for each option, the analysis values will be calculated and updated in the quotepage. The resulting quotepage should resemble this:
