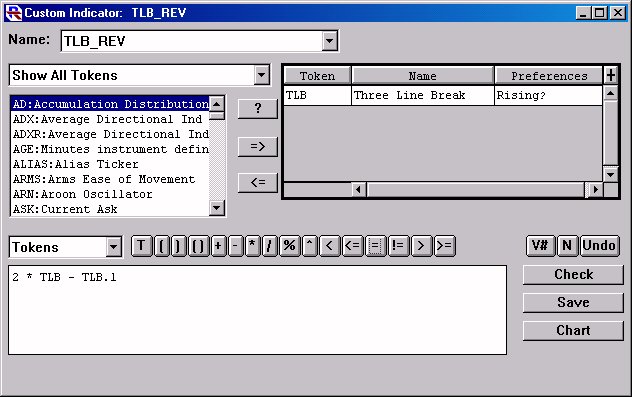
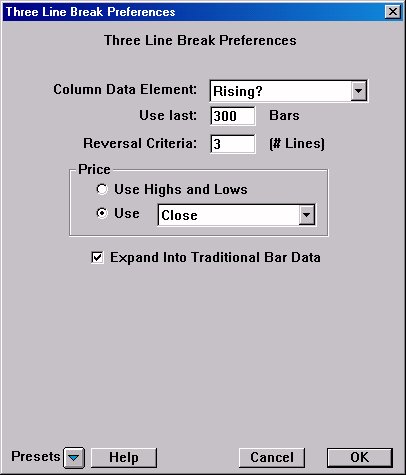
Now, let's create a custom indicator involving the TLB token. To create a custom indicator, go to "Setup: Custom Indicator", and setup the indicator based on the settings below.


Then save the custom indicator with a name like "TLB_REV" (for Three Line Break Reversal indicator).
In this custom indicator, we have set the TLB token up to use the data element "Rising?". As mentioned on the previous page, this token results numerically in a value of 1 when rising, and 0 when falling. Based on this, let's take a closer look at the syntax of our custom indicator...
2 * TLB - TLB.1
This is taking twice the current TLB value and subtracting the TLB value for the previous bar. There are four possible outcomes to this indicator, each with a specific meaning representing the state of the TLB.
2 * TLB - TLB.1 TLB TLB.1 Result
Description 0 1 -1 This indicates that the TLB just broke down. The current TLB value is 0 (meaning it is currently falling) but the previous TLB value is 1 (meaning it was rising on the previous bar). This tell us that it has just broken down on the current bar. 0 0 0 This indicators that the TLB has maintained a falling state. It was falling on the previous bar (TLB.1 = 0) and it is still falling (TLB = 0). 1 1 1 This indicators that the TLB has maintained a rising state. It was rising on the previous bar (TLB.1 = 1) and it is still falling (TLB = 1) 1 0 2 This indicates that the TLB just broke up. The current TLB value is 1 (meaning it is currently rising) but the previous TLB value is 0 (meaning it was falling on the previous bar). This tell us that it has just broken up on the current bar.
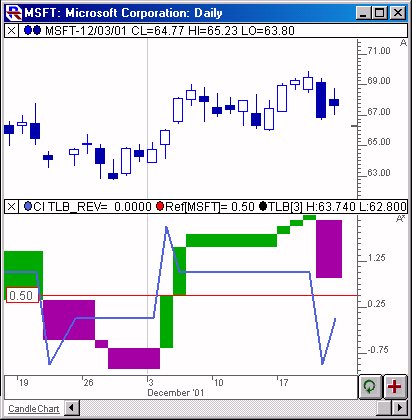
Now, let's take a look at how this indicator looks when added to a chart. Open your chart and hit the "Insert" key on your keyboard to bring up the "Add Indicator" window. Choose "Custom Indicator" from the list on the left, then choose "TLB_REV" from the list of custom indicators. The resulting indicator should look something like this...

The lower window pane of this charts shows our Custom indicator, overlaying the TLB indicator, with a reference line drawn at 0. This pane is setup to use multiple scales, with the visible scale represent our custom indicator values. As you can see, our custom indicator spikes up to 2 whenever the TLB breaks up, then settles back to 1 while it continues in it's rising state, then spikes down to -1 during a negative reversal, then settles back to 0. This indicator is not necessarily effective in a chart, but can be especially effective when used in Custom QuotePage Columns, which we'll explore next.
Let's now move on to Using the TLB Custom Indicator within a Custom QuotePage Column
If you have any questions concerning the above description, contact us.

