Brackets (RTX)
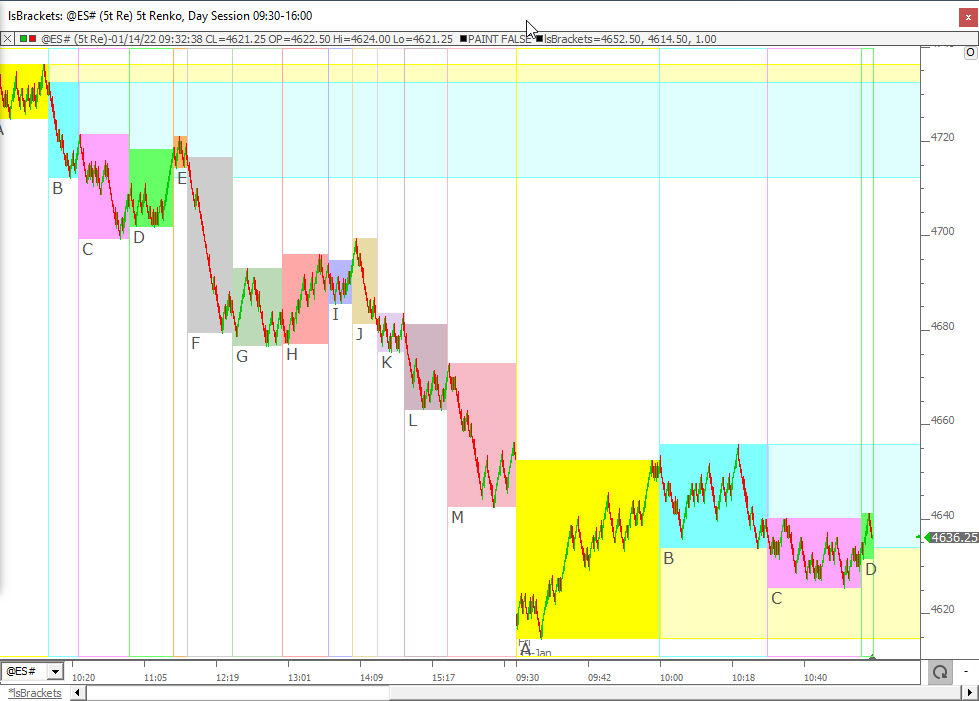
The Brackets RTX Extension is designed to clearly box and identify the price action within each time-based period (bracket) with options to label, color, and extend the brackets horizontally and vertically.
Indicators that study price movement with the goal of showing when an instrument is overbought or oversold.
The Brackets RTX Extension is designed to clearly box and identify the price action within each time-based period (bracket) with options to label, color, and extend the brackets horizontally and vertically.
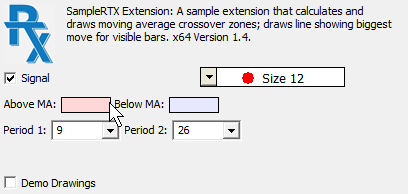
A sample RTX extension that draws a trendline showing the maximum price excursion within the visible portion of the chart. Zoom the chart in/out using mouse wheel and the trendline will redraw for the visible bars. Changing periodicity also affects the visible bars; the SampleRTX will adjust to new visible bars of the new periodicity. For those interested in RTX development, source code is provided for this RTX in the InvestorRT\rtx\lsSampleRTX directory.
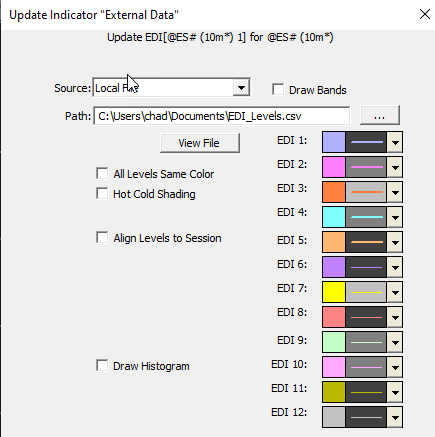
The External Data Indicator (EDI) allows users to import custom daily support and resistance levels from csv or text files. These files may be local or on a remote web server. Up to 12 levels may be imported for each instance of EDI. This video demonstrates how to properly format the csv or text file. The ability to share a file from a web server allows a single user or educator to share his levels automatically with a large group of users.
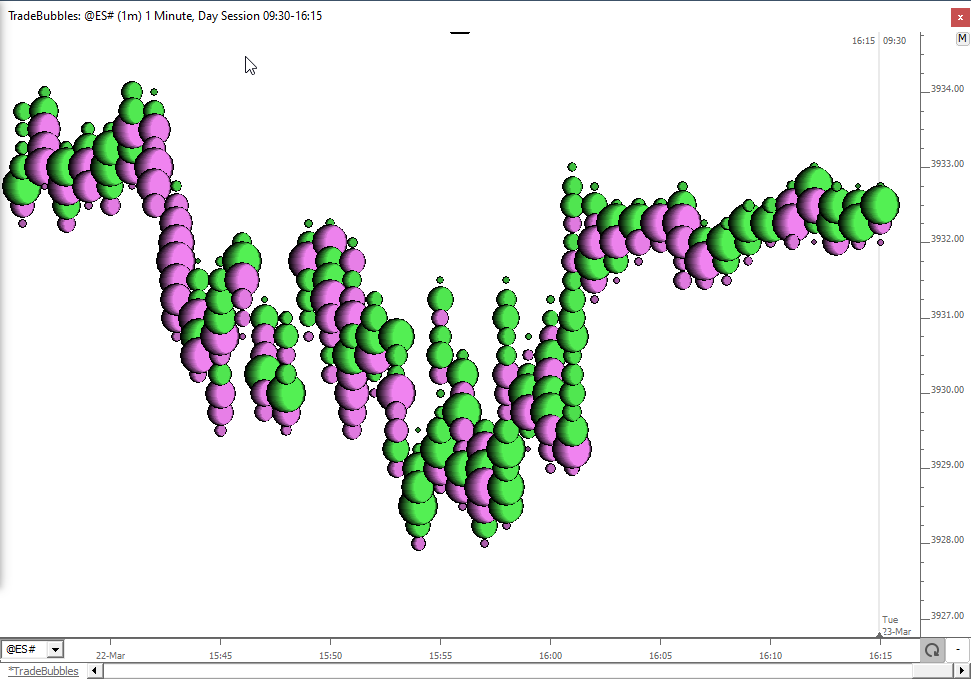
TradeBubbles is a component of the Investor/RT Volume Analysis package. The TradeBubbles extension draws 3-dimensional bubbles at each price within the bar. The size and coloring of the bubbles are variable, driven by volume-at price data. The most recently touched prices are drawn in front. The extension has a horizontal positioning option and a horizontal offset and drift option. These settings control drawing so that the more recently touched prices are drawn further right. Filtering options are available at both the trade and price level (e.g. consider only big trades > 10 lots or consider only prices with large volume > 1000). With the flexible position options the TradeBubbles can be effectively combined with other indicators such as VolumeScope or can be positioned between candles with the Centered (Right) or Centered (Left) alignment options.
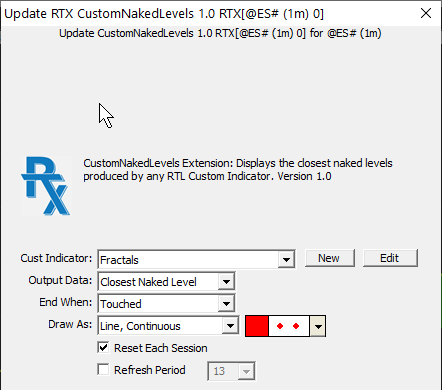
The CustomNakedLevels RTX Extension is designed to display the closest naked levels produced by an RTL Custom Indicator.
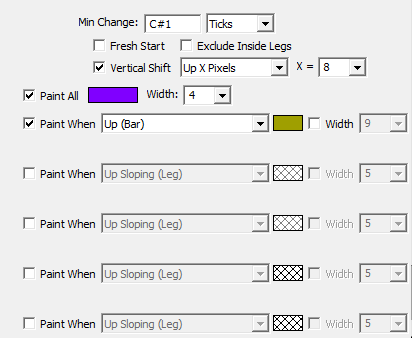
The PaintZigZag (PZZ) RTX Extension paints the legs of the Zig Zag indicator based on a number criteria of each leg or each bar.
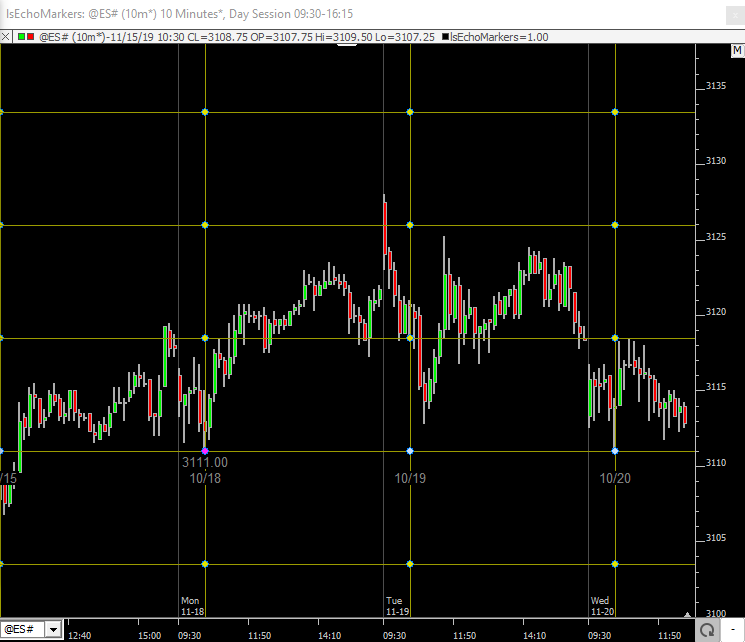
The RTX EchMarkers Indicator is a Drawing Tool for placing markers that repeat (echo) at the same time and price in prior or future trading sessions
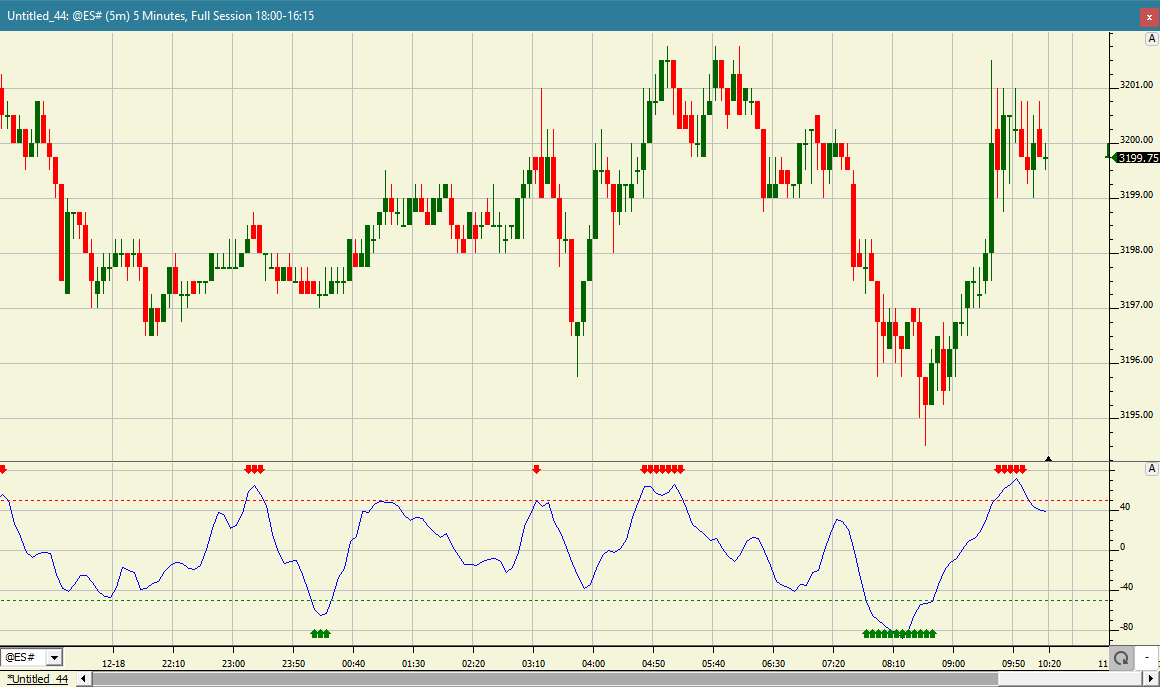
The Chande Momentum Oscillator (CMO) is a technical momentum indicator developed by Tushar Chande. The CMO indicator is created by calculating the difference between the sum of all recent higher closing bar changes and the sum of all recent lower closing bar changes. This result is then divided by the sum of all price changes over the specified number of bars. Finally, the result is multiplied by 100 to give the CMO a range -100 to +100. Typically, an instrument is considered to be overbought when the raw value of the oscillator is above 50 and oversold when it is below -50.
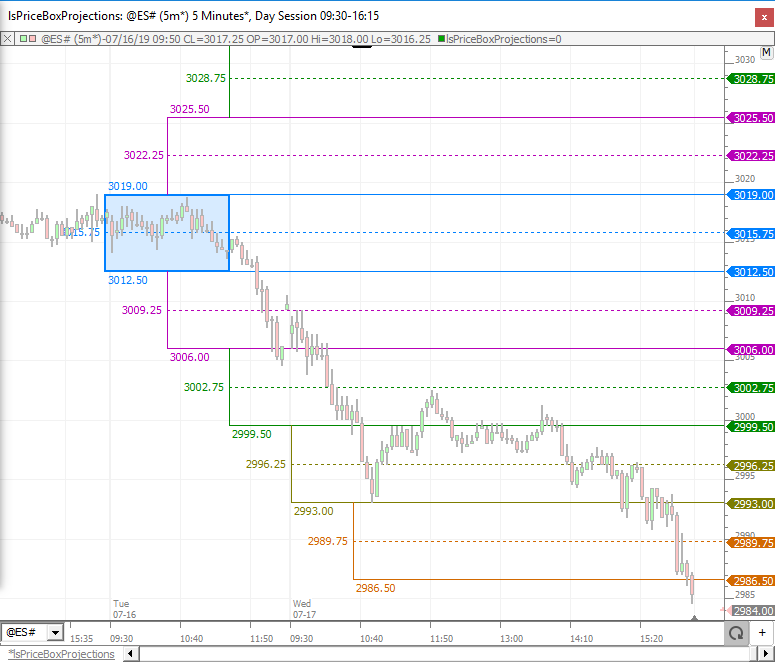
The PriceBoxProjections RTX extension (PBP) is a drawing tool that enables the Investor/RT user to draw an initial price box; the indicator then projects multiple boxes above and below with matching range and offset horizontally by a user-specified distance expressed in bars, pixels, or % of width. The projection boxes are designed to tacitate identification of key reversal opportunities. The box can be setup to snap to the high and low of the bars it contains or the user may adjust the high and low manually by dragging any of the four corners or sides of the box.
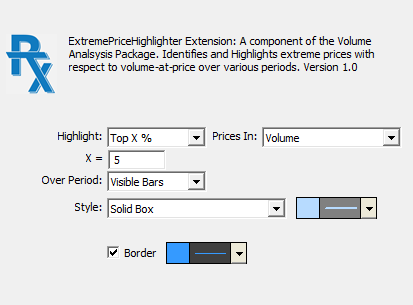
ExtremePriceHighlighter (EPH) is a powerful RTX extension that identifies and highlights extreme prices over various periods with respect to volume-at-price data.