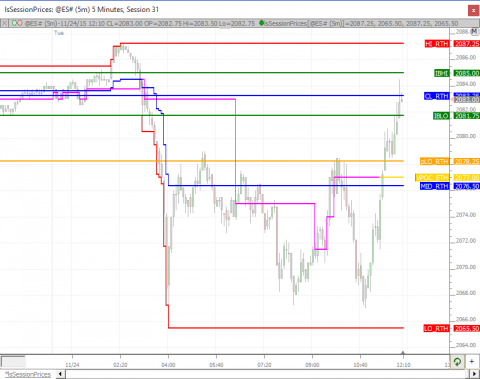
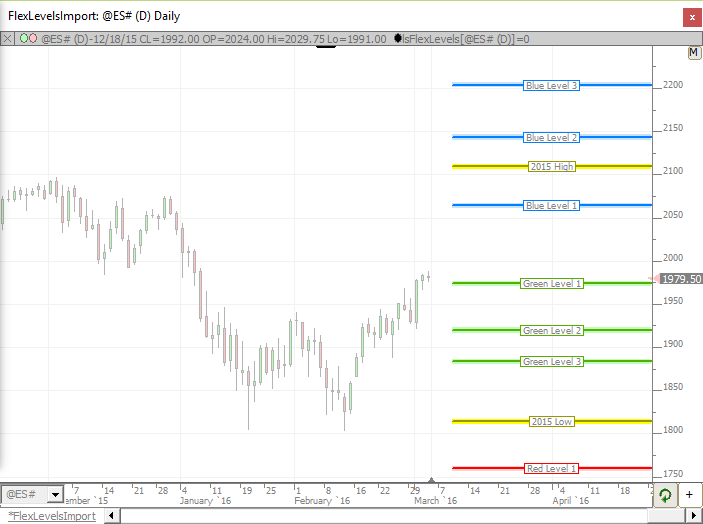
Price Based

Indicators that study price movement with the goal of showing when an instrument is overbought or oversold.

DayTypes (RTX)

The DayTypes RTX Extension determines the developing day type throughout the session and labels each bar with the day type in effect as of that bar.  The determination of day type is rooted in Market Profile methodology and is based on the relationship of the range of the initial balance (1st 60 minutes of trading) relative to the range of the full session and the relative location of the closing price.  

Sine Wave (RTX)

The SineWave RTX extension is the RTX implementation of the Ehlers Sine Wave indicator. See Cybernetic Analysis for Stocks and Futures by John Ehlers. Two forms of the indicator are supported, known as the CyberneticsAnalysis and RocketScience method, selectable as a user preference.

Volume Candles (RTX)

Volume Candles draws a candle, volume profile, and volume as text, for each bar, making efficient use of the horizontal space available for each bar.  It is recommended to set the drawing style of the instrument to "Invisible" and then add the VolumeCandles to the instrument pane to replace the bars.  Each of the 3 elements is optional, giving users the ability to plot candles with volume profiles, volumes with volume as text, etc.  User must ensure there is enough room vertically and horizontally to properly display elements.  To create more horizontal space, use the mouse scrollbar (or up/down arrow keys on keyboard).  To create more vertical space, use the mouse scrollbar while holding down the shift key.

Double Top (RTX)

The Double Top RTX extension identifies double tops and bottoms and extends the lines until they are taken out by a future bar. User parameters control the look back period (in bars) and the minimum pullback (in ticks) and the minimum spread (in bars) necessary to detect adjacent tops (and bottoms).

Price Time Highlighter (RTX)

The Price Time Highlighter provides highly customizable highlighting of price (range) and bar(s) inside any chart pane with user specified color settings.

Session Prices (RTX)

The Session Prices RTX extension calculates common price levels of interest on up to three different sessions independent of the session used by the chart. These types of calculations have been available in Investor/RT for some time but each line required its own instance of the Session Statistic indicator and perhaps the MPD indicator, making management of many lines difficult.

Clear (RTX)

The Clear RTX Extension is an implementation of the Clear Method, a method for determining short term swing direction, described by Ron Black in his 2010 article in Stocks and Commodities Magazine titled Getting Clear With Short-Term Swings. The indicator can be plotted on any timeframe. RTX Clear produces a color coded output line showing the current swing direction and produces a signal on any bar when the direction reverses. During an up swing, if price penetrates (clears) the highest low of the move, the swing remains intact, otherwise a down swing begins.

Chartmill Value Indicator (RTX)

The Chartmill Value Indicator(CVI) appeared in the January 2013 issue of Technical Analysis of Stocks and Commodities. The article was written by Dirk Vandycke. The CVI represents a standard deviation from a moving average, which can be applied to any price series over any period. The concept is simple. As prices rise, they will eventually rise above a moving average. Eventually, the moving average will begin to rise as well. At this point, prices need to continue to rise to increase the spread between the current price and the underlying moving average.

Trail of Intentions (RTX)

Trail of Intentions (TINT) is an RTX Extension designed to display historical snapshots of the depth of market (order book). The market depth provides numeric insight into the intention of traders to buy and sell at various prices. TINT provides a wealth of options to visually identify relative size and changes in sizes among prices within same snapshot or from snapshot to snapshot over time.

Price Volume Pattern (RTX)

PVP is a powerful order flow pattern matching facility that works hand-in-hand with VolumeScope. It is designed to identify buy and sell volume-based patterns within a sequence of one or more prices within each bar. One-price, two-price and three-price patterns can be identified at the high of bar, low of bar, the highest or lowest occurrence within the bar, or all occurrences within each bar. Within each price within a bar, volume, ask volume, bid volume, or delta may be compared to specific values, or to multiples of volume, ask volume, bid volume, or delta. A secondary criteria is optional for each price. Prices that meet the specified criteria are identified with a drawing style such as Solid Box, Hollow Box, Dot, or Line. Customization of each style is possible by specifying a number of horizonal slices and an offset (which slice) to use. Each PVP indicator in a chart can thus be setup to draw into a different slice for each price.

Pages