RTX

Price Volume Pattern Indicator (PVP) - Data Preferences (2 of 3)

Price Volume Pattern Indicator (PVP) - Data Preferences (2 of 3)

This is the second video in a series of three on the Price Volume Pattern indicator being released in version 12.3. The previous video offered an introduction to the indicator along with usage examples while this video focuses more on Data Preferences. Video 3 will focus on Drawing Preferences.

Price Volume Pattern Indicator (PVP) - Introduction (1 of 3)

Price Volume Pattern Indicator (PVP) - Introduction (1 of 3)

Introduction to the Price Volume Pattern Indicator. This is the first video in a series of three. PVP a new indicator in version 12.3 and was developed using the RTX development tools. It is designed to identify volume-based patterns among a sequence of one or more prices within each bar. This video introduces the user to 1, 2, or 3 price pattern examples. The videos that follow cover Indicator Preference and Drawing options.

Price Volume Pattern (RTX)

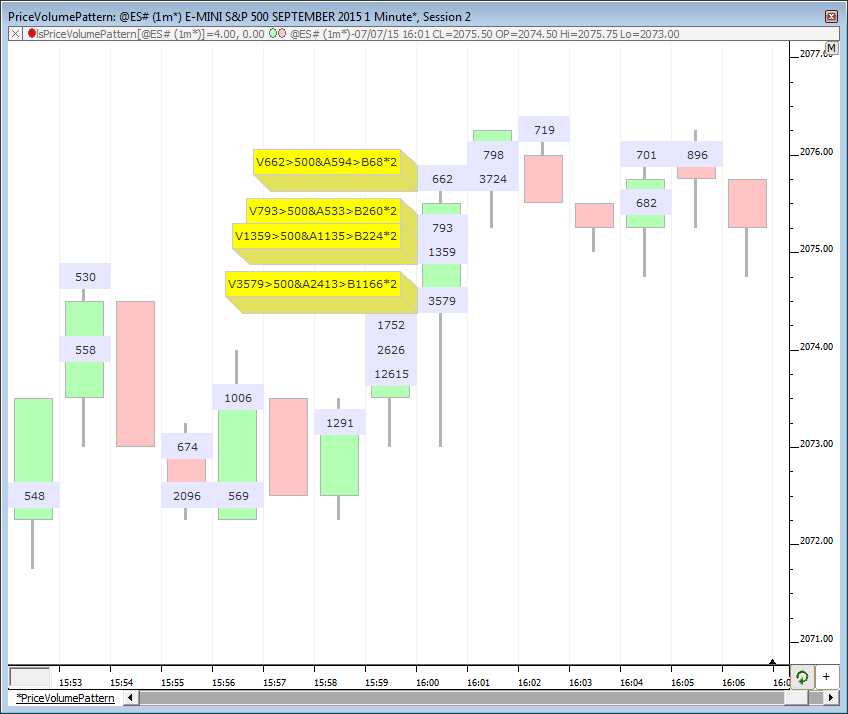
PVP is a powerful order flow pattern matching facility that works hand-in-hand with VolumeScope. It is designed to identify buy and sell volume-based patterns within a sequence of one or more prices within each bar. One-price, two-price and three-price patterns can be identified at the high of bar, low of bar, the highest or lowest occurrence within the bar, or all occurrences within each bar. Within each price within a bar, volume, ask volume, bid volume, or delta may be compared to specific values, or to multiples of volume, ask volume, bid volume, or delta. A secondary criteria is optional for each price. Prices that meet the specified criteria are identified with a drawing style such as Solid Box, Hollow Box, Dot, or Line. Customization of each style is possible by specifying a number of horizonal slices and an offset (which slice) to use. Each PVP indicator in a chart can thus be setup to draw into a different slice for each price.

Vervoort Oscillator (RTX)

In his article "The Quest For Reliable Crossovers" (Stocks and Commodities Magazine, May 2008) author Sylvain Vervoort explains a trading method using the crosses of two moving averages: a zero-lag triple exponential moving average of the typical price HLC/3 and the Heiken-Ashi Close. The Vervoort Oscillator plots the difference between these averages. Vervoort recommended a 55 period average (1 period look back) on daily charts.

Polynomial Regression Channel (RTX)

Polynomial Regression Channel (PRC) is an RTX Extension indicator that draws a best fit n-degree polynomial regression line through a recent period of data. Setup parameters for the indicator include the degree of the polynomial (1 - 6) and number of bars to analyze. Bands are drawn above and below the regression line between two user-specified multiples of standard deviation. The bands self adjust for volatility.

Math Lines (RTX)

The Investor/RT Math Lines Indicator is the Linn Software implementation of the popular Murrey Math Lines. The Math Lines indicator produces a series of equidistant price-based support and resistance levels. Each level is labeled from 1/8 thru 8/8. The 8/8 (or 0/8) lines are considered the most difficult to break. 1/8 and 7/8 lines are considered weak support and resistance. 2/8 and 6/8 lines are considered strong reverse points. 3/8 and 5/8 are considered areas where it is very likely that the price will either pierce this range fast or will remain inside it for a long time.

RTX Extensions Introduction Video

RTX Extensions Introduction Video

This video offers an Introduction to the new RTX Extensions feature in all versions of Investor/RT 12.1 or later. This video demonstrates the creation and compilation of a very basic indicator as well as adding it to a chart. A brief review of the RTX Setup Wizard is covered as well as an explanation of some of the aspects of the default .cpp source file that is created by the RTX Setup Wizard. Investor/RT version 12

Risk Reward Chart (RTX)

This is a 1 minute chart of the S&P Emini illustrating the Risk Reward Indicator, a new indicator in Version 12. The Risk Reward indicator is a rectangular drawing tool that studies a range of trading, showing how profit target and stop loss settings would have played out has you entered the market at some base price. For more information on using the Risk Reward indicator see the Risk Reward indicator in the Indicator Library.

Pages