Hi, I'm new to Investor/RT and trying to see if it can work for me. I'm trying to achieve the following:
1) Plot a point and figure chart with VolumeScope on it
2) Display the total volume inside the whole Point and Figure "box" (not at every price level)
3) Highlight with a border boxes that have a high volume relative to recent trailing history. Lets say 1.5 standard deviation above the last 100 boxes
Something that looks like the attached. I'd really appreciate any help regarding this.
Thank you !
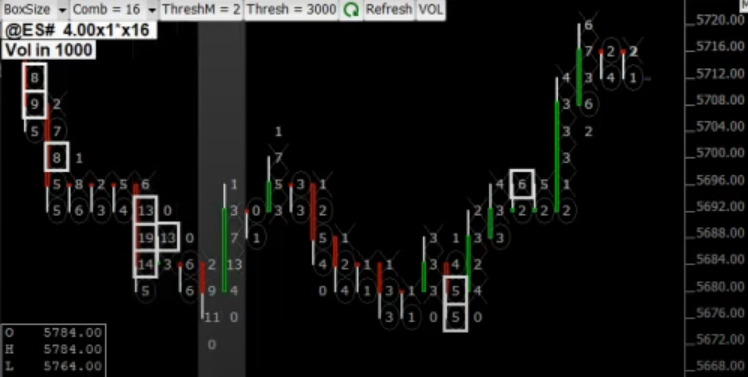
It is a plain PnF chart.As you can see 4x1x16 means the pnf is 4x1, whike 15 is a cluster. White box identifies extremely large vikume. You get it when you use PVP indicator.
To create a cluster, got to elements on chart, pick the tuicker with eight mouse button, and then mark an option to make a cluster. There are multiple options.
Hello,
Just some precisions here
First, it is always difficult to precisely reproduce a chart from a screenshot as you don't have access to the exact settings, but here is an attempt to identify the main components of this chart, together with some information
https://www.linnsoft.com/charts/ef-pnf-combined-esm5
In this chart (obviously a PNF chart, with a periodicity introduced as a box Size and a reversal criteria), the combine Every x prices level is activated
This aggregation of price level can be controlled through a C# Variable button. To access this setting, open the chart element manager and select the main instrument
This feature is very useful for any kind of footprint chart, as the goal here is to have a quick sense of the relative volume distribution, ie one doesn't care about the exact final digit
This is most likely the EPH indicator (extreme price highlighter), knowing that the other possible options are the Multiple Price Highlighter (MPH) or the Price Volume Pattern (PVP) indicator
The EPH allow for an analysis of Volume level (at each price level) among multiple bars, while MPH and PVP typically analyse volume distribution at different price levels (according to a wide range of criteria), but within a single bar.
Please note that the cluster feature is used, within the PVP indicator to identify specific conditions (such as a delta imbalance) on consecutive price levels (a cluster feature is also available in the MPH indicator)
For more information on these indicators :
https:://www.linnsoft.com/techind/multiple-price-highlighter-mph
https://www.linnsoft.com/techind/extremepricehighlighter-rtx
https://www.linnsoft.com/techind/pvp