Core Indicator

External Data Indicator

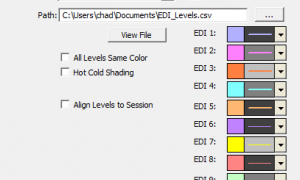
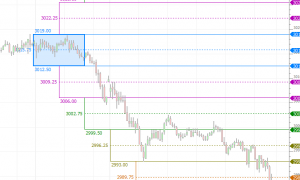
The External Data Indicator (EDI) allows users to import custom daily support and resistance levels from csv or text files. These files may be local or on a remote web server. Up to 12 levels may be imported for each instance of EDI. This video demonstrates how to properly format the csv or text file. The ability to share a file from a web server allows a single user or educator to share his levels automatically with a large group of users.

BarNumbers (RTX)

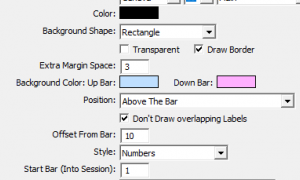
The BarNumbers RTX displays a label for a given bar or set of bars that identifies that bar's sequence from the beginning of its session.  Bars are numbered chronologically from the beginning of each session so that the first bar of any session is bar #1.  This RTX is useful for easily identifying specific bars in a non-time dependent manner, such as for use with trading rooms, collaborations, or mentoring.

TradeViewer (RTX)

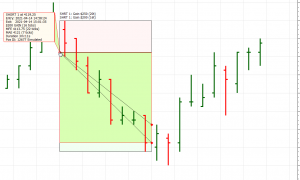
TradeViewer is a trading results visualization tool. It draws lines, markers and color coded rectangles to denote the entry price and exit price of each of your trades with optional highlighting of the maximum favorable (MFE) and adverse (MAE) excursions of price during the trade.

ChartMiniTrader (RTX)

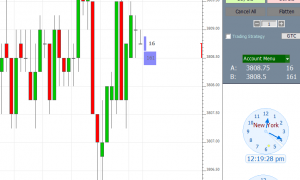
ChartMiniTrader is an RTX extension available to all Investor/RT subscribers. To invoke the Mini Trader, right-click in any multi-pane chart and choose Trade > ChartMiniTrader. The ChartMiniTrader is a minimalist user interface for submitting trading orders that is seen in a sidebar at the right side of the chart. Since the Mini Trader occupies only a small portion of the side typically, the side bar can also be setup to contain other RTX extension such as a Clock, or various FlexMeters. For users of CQG, Gain, and RIthmic order routing, server side OCO bracket orders are supported using Trading Strategy setups.

Edit User Variable (RTX)

The EditUserVariable RTX Extension is a tool designed to facilitate changing the value of a V#, C#, or T# user variable. Chart buttons, setup with purpose Set V# Variable or Set C# Variable can also be used to accomplish this. If a chart button to set a variable has no specific value, then clicking the button prompts for the value in a dialog box. This works well for occasional changes, but is not convenient for making frequent changes to a user variable.

PaintZigZag (RTX)

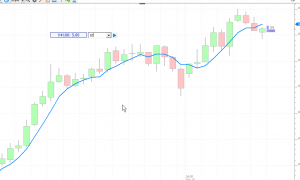
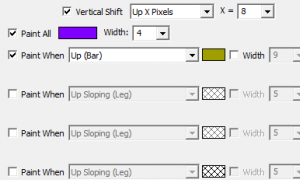
The PaintZigZag (PZZ) RTX Extension paints the legs of the Zig Zag indicator based on a number criteria of each leg or each bar.

EchoMarkers (RTX)

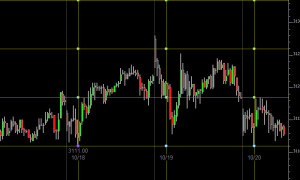
The RTX EchMarkers Indicator is a Drawing Tool for placing markers that repeat (echo) at the same time and price in prior or future trading sessions

PriceBoxProjections (RTX)

The PriceBoxProjections RTX extension (PBP) is a drawing tool that enables the Investor/RT user to draw an initial price box; the indicator then projects multiple boxes above and below with matching range and offset horizontally by a user-specified distance expressed in bars, pixels, or % of width. The projection boxes are designed to tacitate identification of key reversal opportunities. The box can be setup to snap to the high and low of the bars it contains or the user may adjust the high and low manually by dragging any of the four corners or sides of the box.

LookBackCandles (RTX)

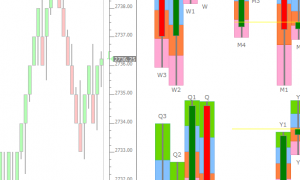
Add the LookBackCandles indicator to your chart to see at a glance how the current trading price relates to various lookback periods of trading: today, this week, this month, last few weeks, etc. Up to 8 lookback periods are shown in one compact display giving the trader both short and long term perspective on price action over various period of the recent past.  LookBackCandles (LBC) can display daily, weekly, monthly, quarterly, and yearly candles; it can depict price action for any lookback period (such as 1 year back, 2 months back).  LBC has an option to utilize its own scale to maximize the vertical space. Or it may share the same scale as the underlying data/instrument plotted in the chart.  Up to 8 periods may be plotted with each instance of LBC and each may be given it's own colors and style or all lookback periods may share the same common colors and style.  Each period may be labeled in order to make it clear what timeframe each bar/candle represents.  A Current Price Line option makes it clear where the current price is in relation to each period, and a Paint Quadrants option allows the background of each of the quadrants of each bar to be drawn in a user-specified color.  All prices computed by LBC may be store into a series of User Variables (V#) that are automatically labeled.  LBC may be aligned to the left or right of the window pane, or dragged into the SideBar by simply dragging onto the scale at the right.

Pages