Core Indicator

ScatterPlot (RTX)

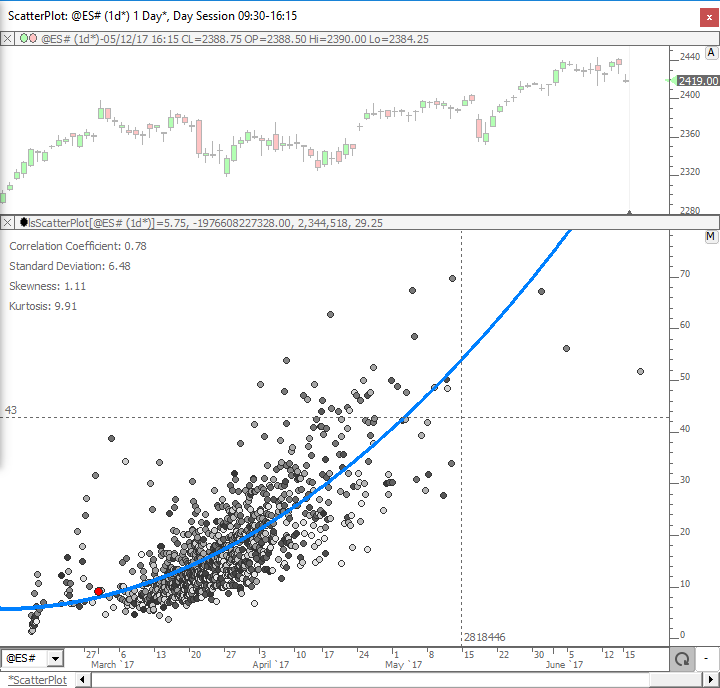
ScatterPlot takes two custom indicators and plots one on the horizontal (X Axis) and one on the vertical (Y Axis) and then computes a best fit polynomial regression line through the data of user-specified degree. Any two custom indicators may be used for the data set of this analysis. Each data point represents the values of the two custom indicators on any given bar. Each bar is drawn as a point/dot in the scatter plot. For example, the indicator can plot the daily volume versus the daily range in price.

Trading Rule Indicator

The Trading Rule Indicator operating inside a chart tests a user-specified trading signal. When the trading signal fires true, the trading rule indicator executes a user-specified trading order.

Chart Buttons

Chart Buttons enable you to add push buttons or menu buttons to any chart window to perform a variety of actions as shown in the image below. Buttons can be added to any pane of any chart just as you would add any indicator. If you have a series of button indicators that you wish to appear in every chart, set the scope of the button to "All Charts, Any Instrument" at the bottom of the Button Preferences window. From that point forward, any chart you open or create in the future will have the these ticker and periodicity buttons.

Zig Zag Indicator (ZIG)

The Zig Zag Indicator is a series of trendlines that connect significant tops and bottoms on a price chart. The Minimum Price Change parameter specifies the percentage that the price must move in order to form a new zig or zag leg. It can be used to identify potential chart patterns and Elliot Wave formations.

The Minimum Price Change setting of the Zig Zag and Zig Zag Oscillator indicators can be expressed in absolute dollars ($) in addition to percent (%)

Zig Zag Oscillator Indicator (ZZO)

The Zig Zag Oscillator indicator provides a way of viewing the Zig Zag Indicator information in a different form, oscillating about 0. The indicator represents the percent change at each bar of the current price from the base price of the current Zig Zag leg. When the Zig Zag is currently in an uptrend state, the Zig Zag Oscillator will be above 0. Similarly, when the Zig Zag is in a downtrend state, the oscillator will be below 0. Optionally, reference lines may be drawn at any percent change level.

Signal Statistics (SSTAT)

The Signal Statistics indicator (SSTAT) allows for statistical calculations on signals, including summation, consecutive signals, frequency, bars since last signal, change since last signal, and more. SSTAT allows the user to select any existing scan or signal, and any custom statistical result to calculate on that scan/signal. Currently, the available statistical results are:

Session Statistics (SESST)

The Session Statistics Indicator computes historical statistics for an instrument or an indicator. The The Session Statistics preferences use the general format: [Statistic] of [Price] of the [First/Last] X [Minutes/Bars] of the Session The Statistic options include:

Signal Markers

The Signal Marker indicator tests a user specified RTL signal or a specified Plugin Indicator that produces a signal using the periodic data in the chart. The purpose of the indicator is to mark all of the bars for which the signal is true. The signal marker setup can also perscribe a particular signal action to be executed when the signal fires true on the current bar forming in real-time. Signal Actions can in turn trigger the execution of a Trading Order and many other alert actions.

Position Indicator (POS)

The Position indicator calculates for any bar, the position of that bar relative to the start or end of session. The calculated position can be expressed in bars, minutes, or seconds from the start or end of trading session. Here is the full list of results  available using the Position Indicator:

Mixed Periodicity Data (MPD)

The Mixed Periodicity Data Indicator (MPD) gives the user access to different periodicities of data than the periodicity of the underlying instrument or scan. The MPD preferences ask for both a periodicity and the data (price) from that periodicity that will be displayed. MPD essentially loads data of another periodicity, the right-aligns it to the data of the underlying instrument or scan. The MPD data will not generally reflect the date/times show in the horizontal scale along the bottom of the chart. MPD should be consider on it's own scale.

Pages