Core Indicator

TimeAndSales (RTX)

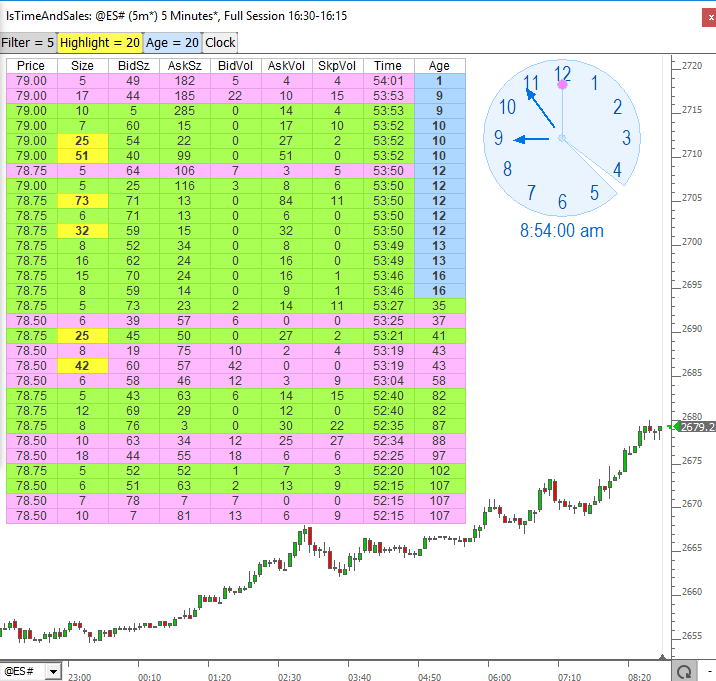
The RTX TimeAndSales extension (TAS)  is used to embed time and sales displays into any Investor/RT chart window. TAS introduces a variety of new time and sales capabilities such as flexible filtering, highlighting and alerting options and much more.  Display columns are user customizable. These include new data items of interest to traders: Skips, Bid Volume, Ask Volume, Age, Ticks Back and Consolidated Trades.

SlopeLines (RTX)

Trendlines are one of the basic trading tools used to follow trends in market data. They are easy to draw in Investor/RT using the trendline drawing tool: click on a starting point; drag and drop on the ending point. Investor/RT has some trendline automation features as well that attempt to determine the current trend and auto draw lines to depict the trend. Introducing SlopeLines - a new tool that takes trendline automation to the limit.

ChartTradingDOM (RTX)

ChartTradingDOM an RTX extension available to all Investor/RT subscribers. To invoke the DOM, right-click in any multi-pane chart and choose Trade... The ChartTradingDOM is a price ladder supporting single click in the Buy or Sell column to place limit/stop orders at specific prices. For users of RIthmic and CQG order routing, server side OCO bracket orders are supported using  Trading Strategy setups.

Spread Matrix (RTX)

The Spread Matrix RTX extension is designed to automatically compute the optimal number of contracts of shares for each component of a pair.

Colors (RTX)

The Colors RTX Extension is designed to supply the Profile Indicator with custom colors and/or custom letters for drawing TPOs. Up to 50 colors and letters may be customized.

Boundaries (RTX)

The Boundaries RTX extension is designed to allow user to manually identify and mark boundaries (bars or date/times) that can then be used effectively by indicators such as the Profile and Price Statistics Indicator. Visually, the Boundary extension is a horizontal strip at a user-specified height upon which user can click to mark or unmark any bars as the start and/or ending boundary.

Zones (RTX)

The Zones Indicator is designed to automate the identification of zones between a range of prices over a series of bars/time. The primary motivation for the creation of this indicator is to identfy consolidation zones where price remains in a given range over a minimum period bars or time. An Extend Naked option extends the zones until the zone is filled by future price movement. As an example, Zones can identify when price remained in a 10 tick range over a series of 20 bars or more, and once breaking that range, it can extend the naked band until price moves back across the zone.

Clock (RTX)

The RTX Clock indicator provides a display of time in analog and/or digital form with extensive customization options.

True Strength Squeeze (RTX)

The TrueStrengthSqueeze (RTX) Indicator combines the True Strength Index with the Squeeze Indicator.  The True Strength Index attemps to show both trend direction and overbought or oversold conditions using double-smoothing of momentum relative to double-smoothing of the absolute value of momentum.  The Squeeze Indicator identies when the Bollinger Bands are within the Keltner Channel.  Both Bollinger Bands and Keltner Channels center about a moving average of the close with the Bollinger Bands using a multiple of standard deviations and the Keltner Channels using a multiple of Average True

Paint Candles (RTX)

The PaintCandles RTX Extension decorates candlesticks in a variety of ways. The user may choose to decorate all candles or just those candles that meet a specific condition determined by an RTL Signal . Decoration options include the width in pixels, the Position relative to the candle (in pixels offset from candle) and whether to draw inside or outside of the candle.  Up to 4 painting options are available in each instance of PaintCandles, one to decorate all candles and three options to decorate candles based on an RTL Signal being true for that candle (bar).

Pages