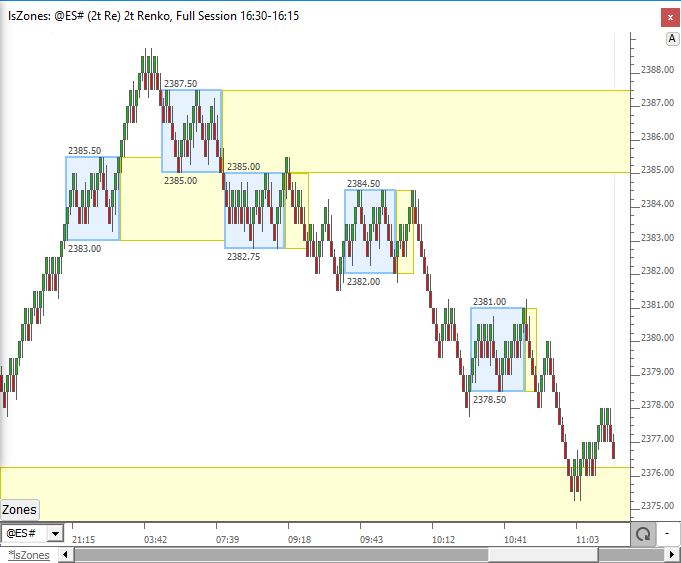
RTX Extension

Boundaries (RTX)

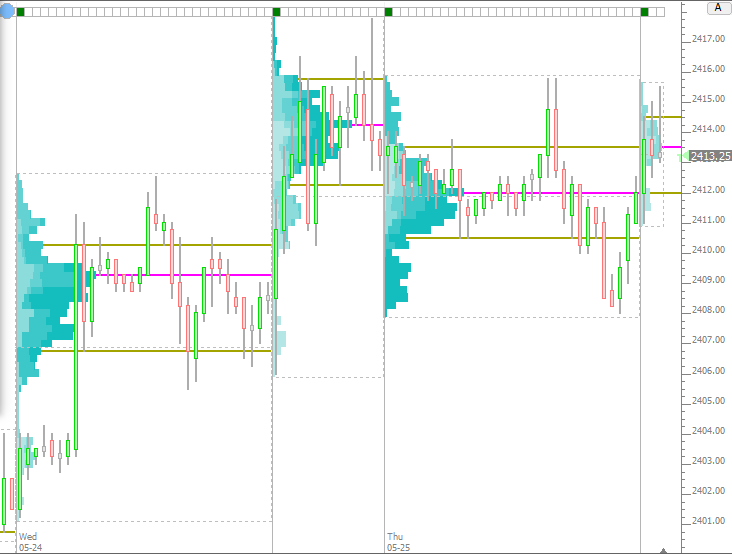
The Boundaries RTX extension is designed to allow user to manually identify and mark boundaries (bars or date/times) that can then be used effectively by indicators such as the Profile and Price Statistics Indicator. Visually, the Boundary extension is a horizontal strip at a user-specified height upon which user can click to mark or unmark any bars as the start and/or ending boundary.

Zones (RTX)

The Zones Indicator is designed to automate the identification of zones between a range of prices over a series of bars/time. The primary motivation for the creation of this indicator is to identfy consolidation zones where price remains in a given range over a minimum period bars or time. An Extend Naked option extends the zones until the zone is filled by future price movement. As an example, Zones can identify when price remained in a 10 tick range over a series of 20 bars or more, and once breaking that range, it can extend the naked band until price moves back across the zone.

Clock (RTX)

The RTX Clock indicator provides a display of time in analog and/or digital form with extensive customization options.

True Strength Squeeze (RTX)

The TrueStrengthSqueeze (RTX) Indicator combines the True Strength Index with the Squeeze Indicator.  The True Strength Index attemps to show both trend direction and overbought or oversold conditions using double-smoothing of momentum relative to double-smoothing of the absolute value of momentum.  The Squeeze Indicator identies when the Bollinger Bands are within the Keltner Channel.  Both Bollinger Bands and Keltner Channels center about a moving average of the close with the Bollinger Bands using a multiple of standard deviations and the Keltner Channels using a multiple of Average True

Divergence (RTX)

The Divergence RTX indicator quantifies divergence with a numerical value between two data series using various methods. Each data series may consistent of either price data, cumulative delta filtered, filtered cumulative delta, or any other indicator available in Investor/RT.

Pivot Strategy Optimizer (RTX)

The PivotStrategyOptimizer (PSO) builds upon the PivotStrategyAnalysis (PSA) indicator to create an extremely powerful combination. PSO enables the optimization of any combination of a number of variables within PSA, allowing the user to quickly determine the optimal combination of values which would have resulted in maximized profits. PSO can optimize the target, stop, reset distance, frontrun wiggle, allowable trading hours, number of allowable trades/day, or an infinite array of other variables within the custom indicator upon which the PSA is based.

Paint Candles (RTX)

The PaintCandles RTX Extension decorates candlesticks in a variety of ways. The user may choose to decorate all candles or just those candles that meet a specific condition determined by an RTL Signal . Decoration options include the width in pixels, the Position relative to the candle (in pixels offset from candle) and whether to draw inside or outside of the candle.  Up to 4 painting options are available in each instance of PaintCandles, one to decorate all candles and three options to decorate candles based on an RTL Signal being true for that candle (bar).

Pivot Strategy Analysis (RTX)

The PivotStrategyAnalysis (PSA) RTX Extension allows the user to specify any key daily or weekly price level such as previous high, previous close, or overnight VPOC, and analyze the effectiveness of that level as a pivot point during the following session or week.  The indicator provides for a variety of convenient options including stop, target, frontrun wiggle, reset distance, nature of system, trade limits, and time filters.  The frontrun wiggle determines how far ahead of the level, if any, to enter the trade (defaults to 0).

FlexLevels® (RTX)

The FlexLevels® Indicator facilitates the sharing of key price levels for one or more instruments among a group of Investor/RT users. An educator or trading room mentor or an individual trader first creates a chart with the instrument(s) and the desired reference lines he wishes to share.  Using File > Functions > Export FlexLevels, the price levels are exported to a compact text file (a .csv file).  The exported file contains all of the information about each line/level including: price, label, color, width, position details, and band details, if applicable. 

DayTypes (RTX)

The DayTypes RTX Extension determines the developing day type throughout the session and labels each bar with the day type in effect as of that bar.  The determination of day type is rooted in Market Profile methodology and is based on the relationship of the range of the initial balance (1st 60 minutes of trading) relative to the range of the full session and the relative location of the closing price.  

Pages