EchoMarkers (RTX)
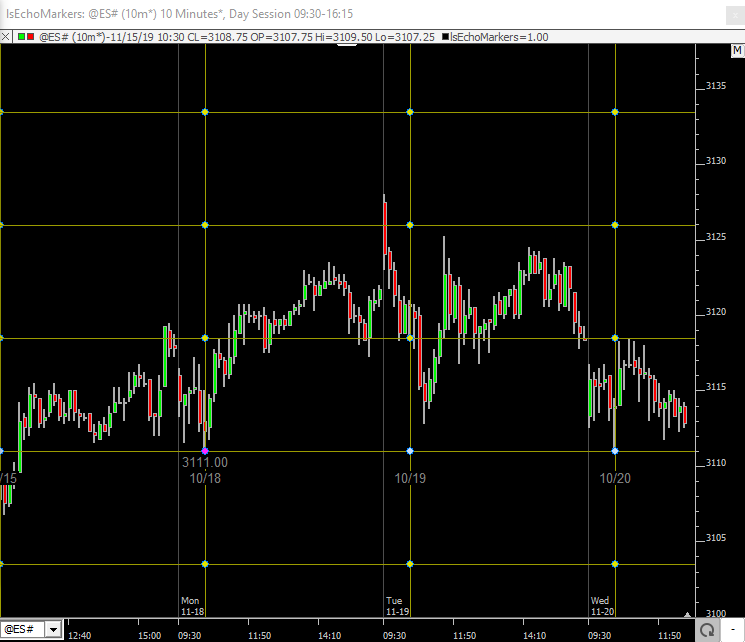
The RTX EchMarkers Indicator is a Drawing Tool for placing markers that repeat (echo) at the same time and price in prior or future trading sessions
The RTX EchMarkers Indicator is a Drawing Tool for placing markers that repeat (echo) at the same time and price in prior or future trading sessions
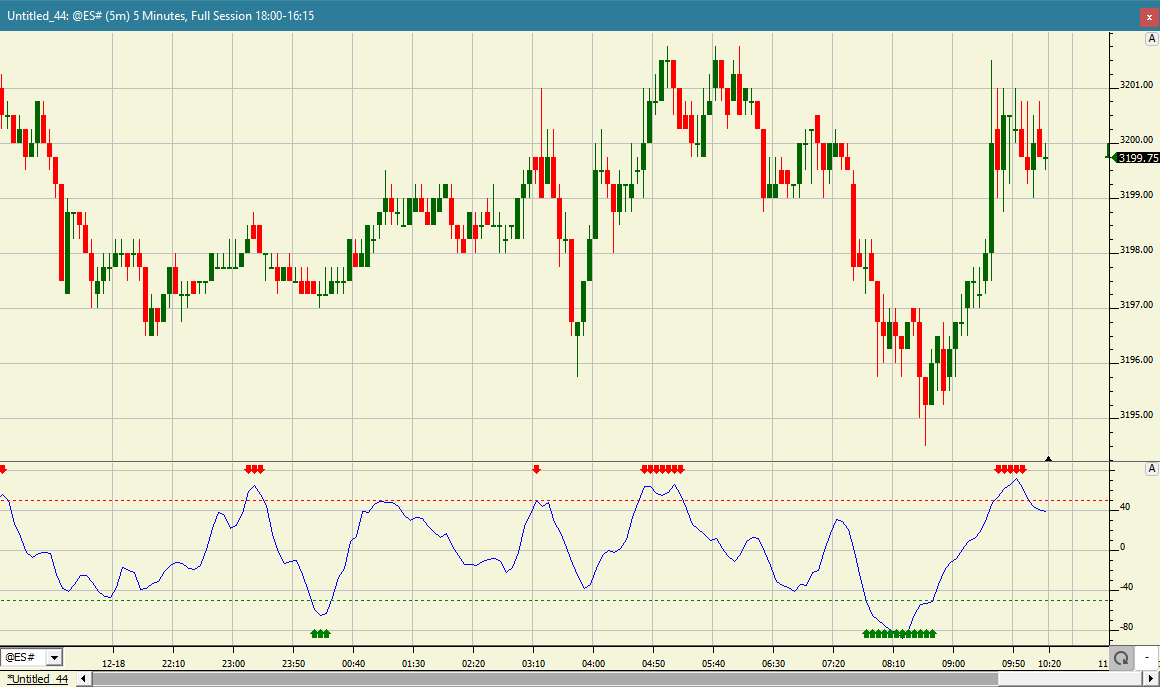
The Chande Momentum Oscillator (CMO) is a technical momentum indicator developed by Tushar Chande. The CMO indicator is created by calculating the difference between the sum of all recent higher closing bar changes and the sum of all recent lower closing bar changes. This result is then divided by the sum of all price changes over the specified number of bars. Finally, the result is multiplied by 100 to give the CMO a range -100 to +100. Typically, an instrument is considered to be overbought when the raw value of the oscillator is above 50 and oversold when it is below -50.
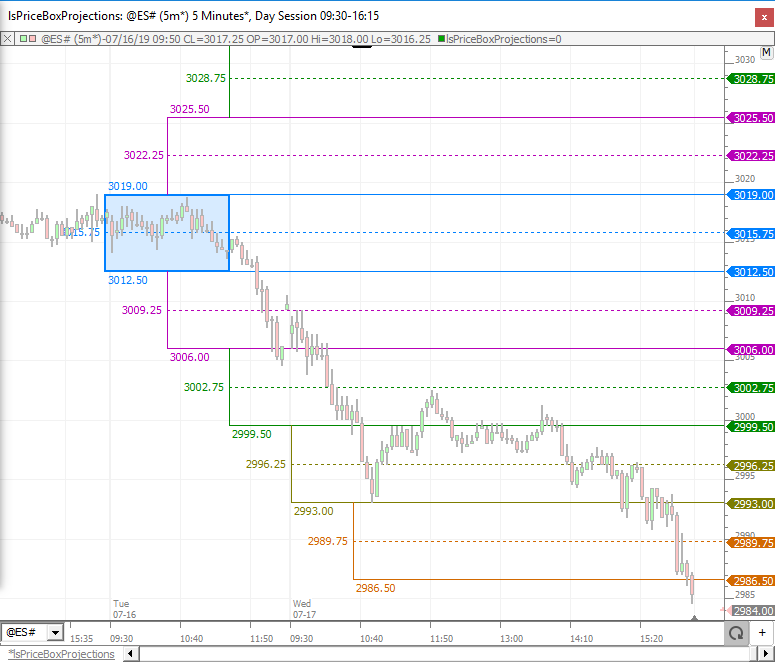
The PriceBoxProjections RTX extension (PBP) is a drawing tool that enables the Investor/RT user to draw an initial price box; the indicator then projects multiple boxes above and below with matching range and offset horizontally by a user-specified distance expressed in bars, pixels, or % of width. The projection boxes are designed to tacitate identification of key reversal opportunities. The box can be setup to snap to the high and low of the bars it contains or the user may adjust the high and low manually by dragging any of the four corners or sides of the box.
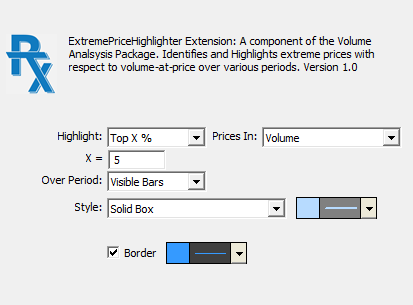
ExtremePriceHighlighter (EPH) is a powerful RTX extension that identifies and highlights extreme prices over various periods with respect to volume-at-price data.
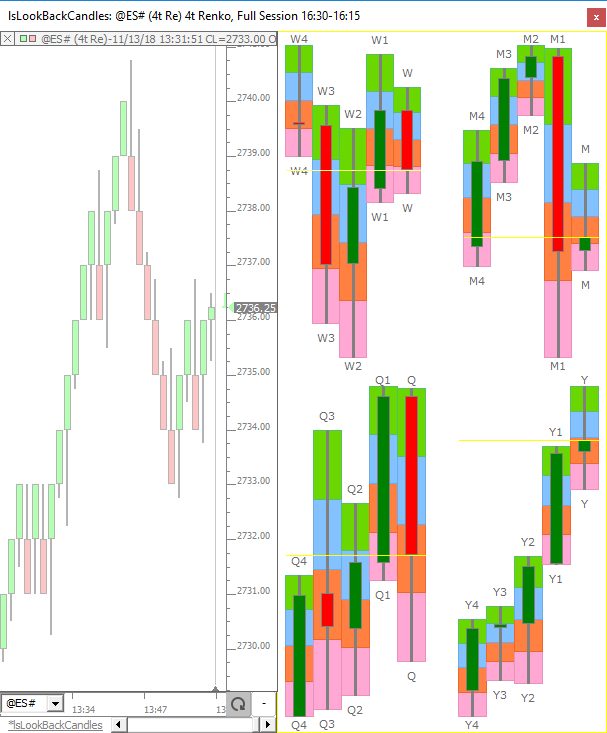
Add the LookBackCandles indicator to your chart to see at a glance how the current trading price relates to various lookback periods of trading: today, this week, this month, last few weeks, etc. Up to 8 lookback periods are shown in one compact display giving the trader both short and long term perspective on price action over various period of the recent past. LookBackCandles (LBC) can display daily, weekly, monthly, quarterly, and yearly candles; it can depict price action for any lookback period (such as 1 year back, 2 months back). LBC has an option to utilize its own scale to maximize the vertical space. Or it may share the same scale as the underlying data/instrument plotted in the chart. Up to 8 periods may be plotted with each instance of LBC and each may be given it's own colors and style or all lookback periods may share the same common colors and style. Each period may be labeled in order to make it clear what timeframe each bar/candle represents. A Current Price Line option makes it clear where the current price is in relation to each period, and a Paint Quadrants option allows the background of each of the quadrants of each bar to be drawn in a user-specified color. All prices computed by LBC may be store into a series of User Variables (V#) that are automatically labeled. LBC may be aligned to the left or right of the window pane, or dragged into the SideBar by simply dragging onto the scale at the right.
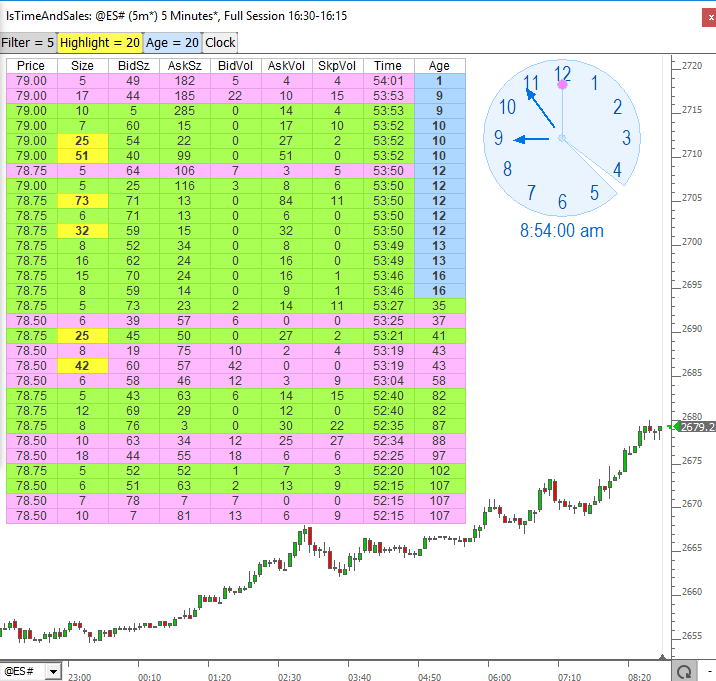
The RTX TimeAndSales extension (TAS) is used to embed time and sales displays into any Investor/RT chart window. TAS introduces a variety of new time and sales capabilities such as flexible filtering, highlighting and alerting options and much more. Display columns are user customizable. These include new data items of interest to traders: Skips, Bid Volume, Ask Volume, Age, Ticks Back and Consolidated Trades.
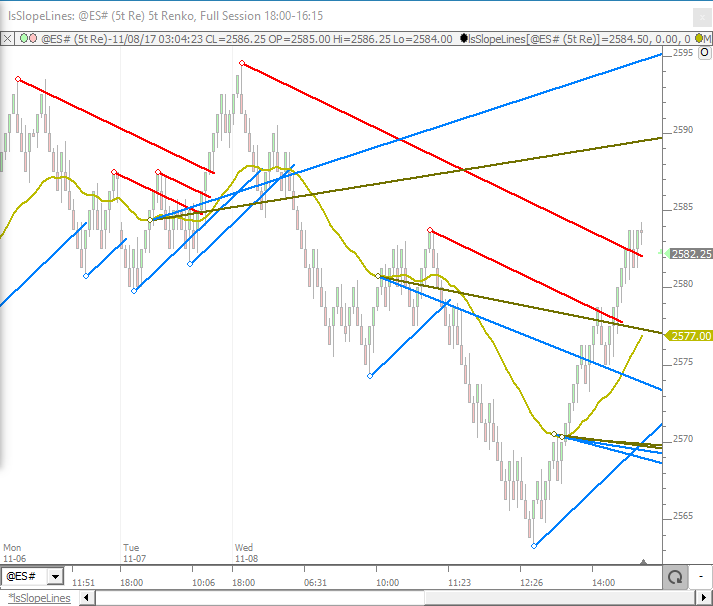
Trendlines are one of the basic trading tools used to follow trends in market data. They are easy to draw in Investor/RT using the trendline drawing tool: click on a starting point; drag and drop on the ending point. Investor/RT has some trendline automation features as well that attempt to determine the current trend and auto draw lines to depict the trend. Introducing SlopeLines - a new tool that takes trendline automation to the limit.
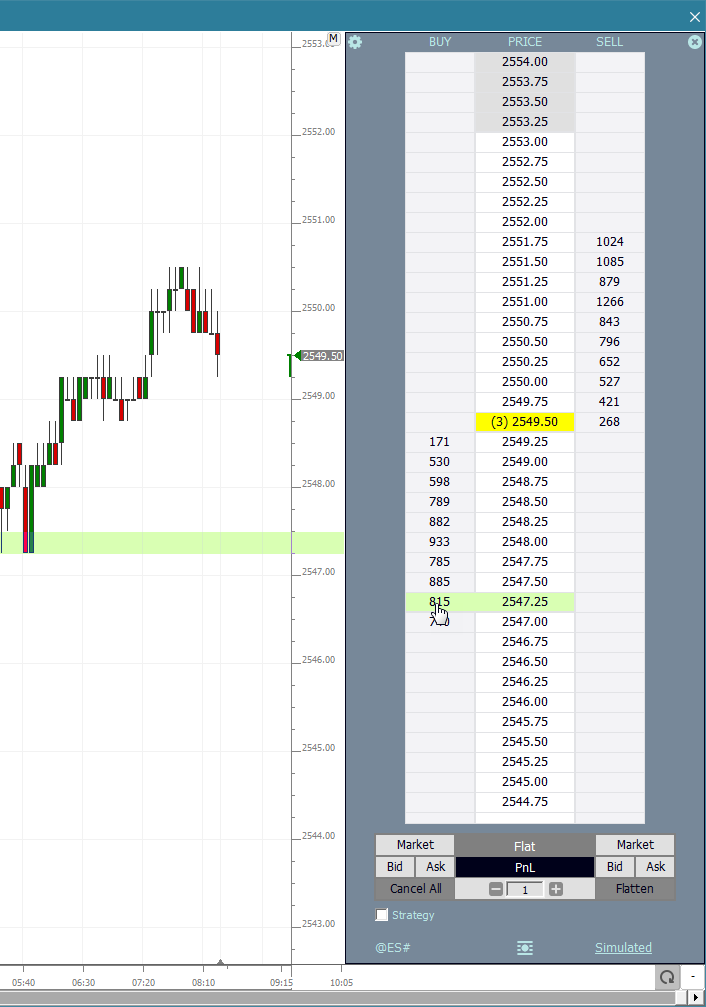
ChartTradingDOM an RTX extension available to all Investor/RT subscribers. To invoke the DOM, right-click in any multi-pane chart and choose Trade... The ChartTradingDOM is a price ladder supporting single click in the Buy or Sell column to place limit/stop orders at specific prices. For users of RIthmic and CQG order routing, server side OCO bracket orders are supported using Trading Strategy setups.
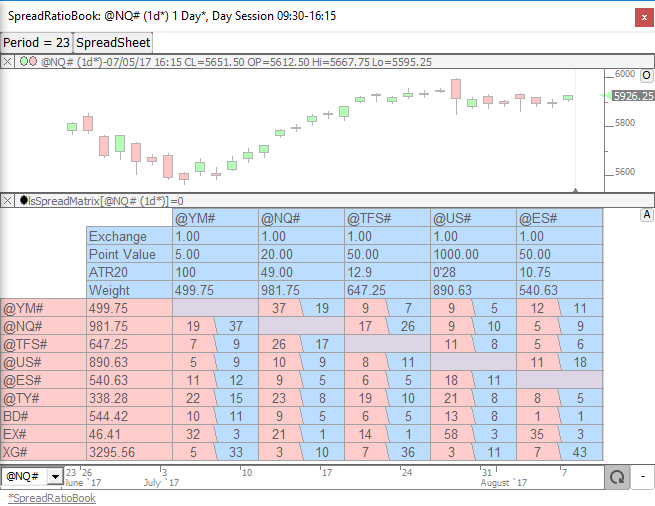
The Spread Matrix RTX extension is designed to automatically compute the optimal number of contracts of shares for each component of a pair.
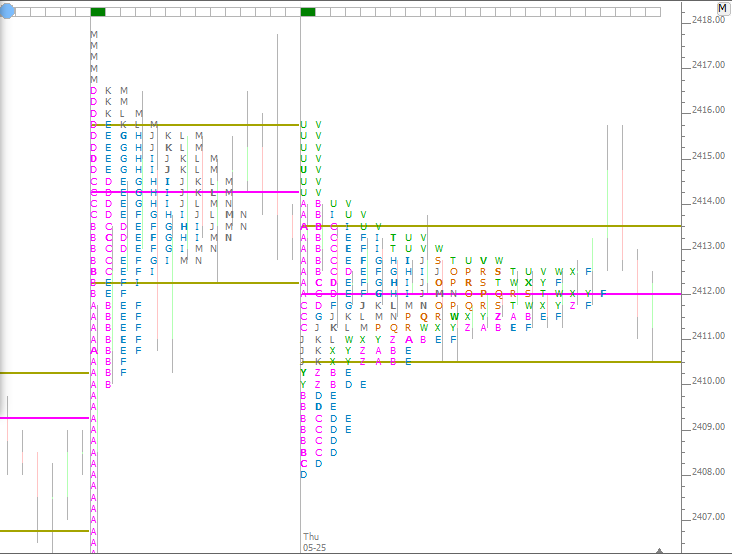
The Colors RTX Extension is designed to supply the Profile Indicator with custom colors and/or custom letters for drawing TPOs. Up to 50 colors and letters may be customized.